
|
|
|
K-12 Schools Data Analytics -- tools, data & methods to reach goals and objectives
This section provides an overview of data, tools and analytical methods used in the Missouri K-12 Schools Data Analytics Workshop (November 17, 2015; Jefferson City, MO). Not demos, these resources can be adapted for use by any school district, city/region or K-12 stakeholder organization. There is no fee for the workshop. Register here. Data Analytics can help a K-12 school, school system or school district more effectively reach their goals and objectives. Whether traditional, charter, public or private, similar tools and methods apply. This section provides an overview of using geographic-demographic-economic data, Geographic Information System (GIS) tools and data analytics methods for analysis of K-12 schools located in Columbia Public Schools (CPS) school district, Missouri. Columbia Public Schools (CPS) is used as an example. Similar data and analyses are available for any school or school district. Tools and methods described here can help leadership, staff and stakeholders answer key questions and facilitate strategic planning. Examining Where We Are Now While most schools and school districts know a lot about the students, often less is known about children's living environment and the broader school district community. See the total population demographic-economic profile for the Columbia school district and Jefferson City school district. The profile tells a story. It helps stakeholders know "where we are now." These profiles are available for all school districts. See more information. Based on data from the American Community Survey (ACS 5-year data), these same data can be used in the interactive ranking tables to compare and contrast one district with another, districts in a state or a peer group. The ACS School District Special Tabulation provides similar data but for the grade relevant population by type of enrollment universe. See Columbia school district and Jefferson City school district Children's Demographic-Economic Profile by Universe of Enrollment. Small area demographic-economic data can be used to examine children's living environment in vicinity of a school. • Census block and block group level data from Census 2010. - see illustrative view below. • Block group data from annually updated American Community Survey (ACS). - see illustrative view below. • Attributes of students enrolled in the school from the U.S. Department of Education. - see illustrative view below. More geographically detailed characteristics for neighborhoods and school locations are reviewed below in this section. Columbia Public Schools School District in Context Columbia Public Schools (CPS) (bold brown boundary) shown in regional context. Attributes for each school are shown here. In addition, we have tagged each school with the census block code, block group code and census tract code (based on location latitude-longitude). These codes enable users to associate demographic-economic data for the school location and the broader vicinity using the DEDE API data extraction tool. 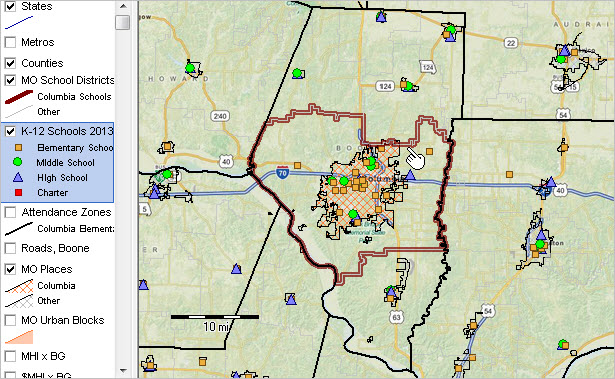 -- view created using CV XE GIS and associated GIS Project -- click graphic for larger showing details. School Locations in Context of District & Other Geography [goto top] Zoom-in to CPS. Pointer at county boundary; the Columbia school district is located in Boone County. Schools are shown by different types of markers. See markers/style in legend at left. Using the query feature, it is possible to identify charter schools as one type of marker, irrespective of grade range. Use the national scope interactive tables to examine characteristics of individual public schools and individual private schools. Rank, query, compare and contrast schools within a state or on a national basis. Attributes for each school district are shown here. Add wide-ranging attributes from other sourcces. 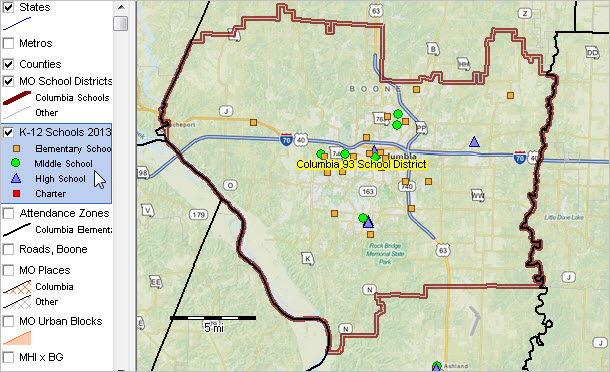 -- view created using CV XE GIS and associated GIS Project -- click graphic for larger showing details. Zoom-in View of Schools; School Characteristics [goto top] Further zoom-in shows schools labeled with name. The identify tool is used to show a mini-profile of a school by clicking on the Fairview ES school marker. The partial view of the profile shows total, free and reduced lunch participation and enrollment by grade. 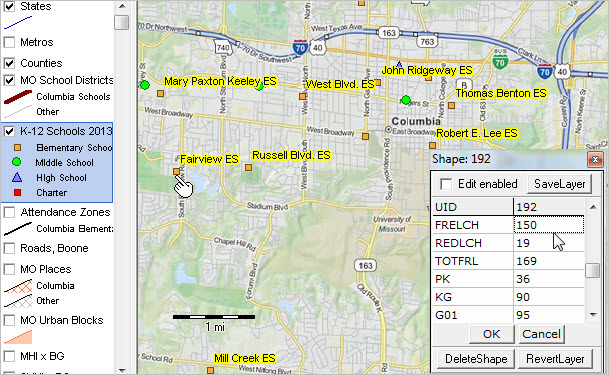 -- click graphic for larger showing details. Selected School Attributes in Table [goto top] The graphic below shows selected attributes of selected schools. The Fairview ES school row shows the same fields/values used to show the attributes by mini-profile in above map view -- total, free and reduced lunch participation and enrollment. Using the data in the table enables spreadsheet type analysis. Optionally place a query on the dataset and extract selected records for use with other software. In this example a query was used to show only schools in the Columbia school district (dataset contains all Missouri public schools) that have grade 1 enrollment greater than zero. 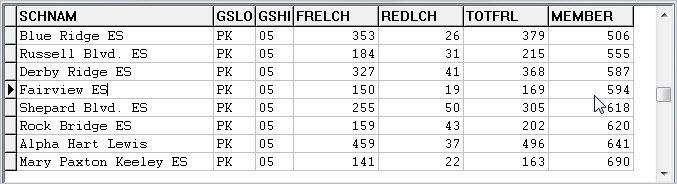 -- click graphic for larger showing details. School Attendance Zones [goto top] Elementary school attendance (red boundaries) are shown in the next graphic. The Columbia school district has three types of attendance zones (elementary, middle, high school). The query feature is used to show only elementary zones, labeled with the zone name. 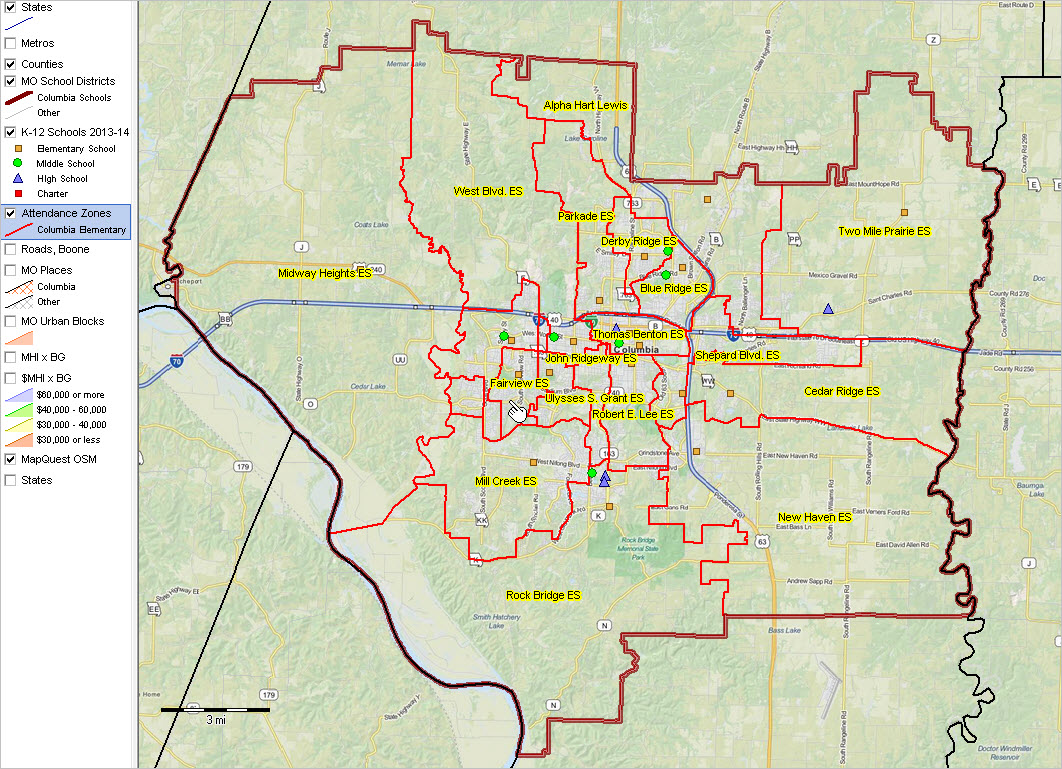 -- click graphic for larger showing details ... larger view shows labels. The 2013-14 school attendance zones (SAZs) are included in the GIS project for all Missouri school districts. Columbia Public Schools SAZs have changed since then, like those of many other districts. The GIS resources can help districts re-district attendance zones in ways other than just redrawing boundaries and displaying maps. Using GIS tools, the degree of compactness of proposed new zones can be more easily evaluated and well as characteristics students as summary statistics. Evaluate alternative grade configurations by school/zone. Are proposed zones unbalanced with regard to race/origin or economic factors? Contact lists for students can be easily developed. Cities/Places & School District [goto top] Cities/places are shown in the next graphic (cross-hatch pattern) in context with the school district. Places are non-incorporated areas of population concentration. 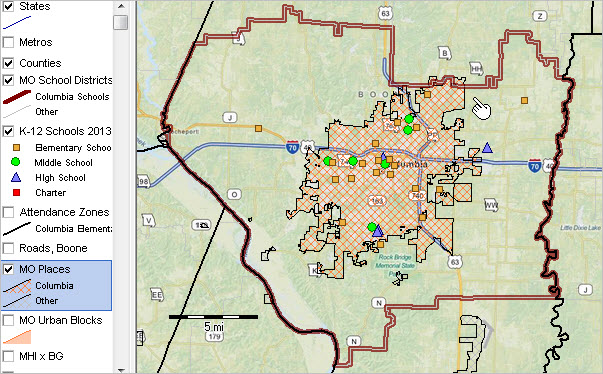 -- click graphic for larger showing details. Road Infrastructure [goto top] Roads/streets are added to the view as shown in the next graphic. Vital to student transportation planning and management, the street density view also helps view the scope of build-out. 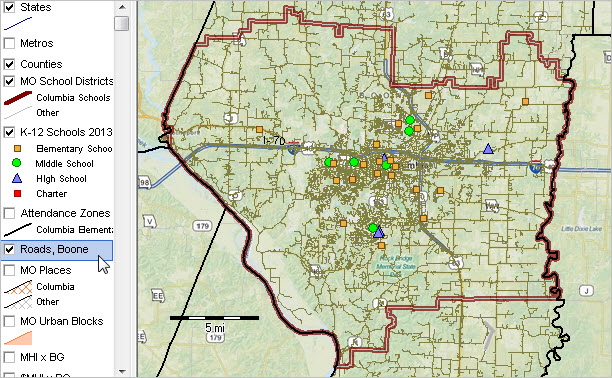 -- click graphic for larger showing details. Schools in Context of Urban/Rural Geography [goto top] Census blocks are categorized as urban or rural based on Census 2010. The graphic below shows urban census blocks with an orange fill pattern. It is easy see that the school near the pointer is located in a predominately rural area. It is also easy to see what parts of the school district are urban or rural and how the urbanization of one district compares to another. See related K-12 Schools by Urban/Rural Status . 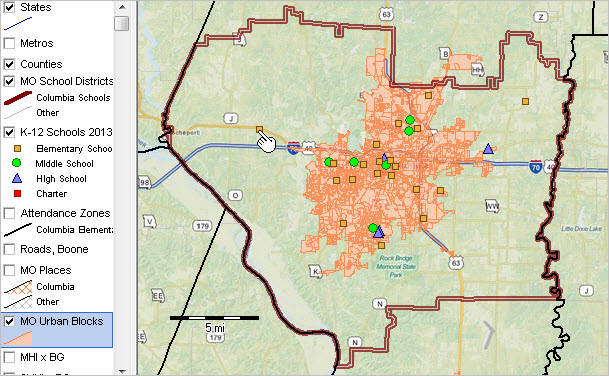 -- click graphic for larger showing details. Patterns of Economic Prosperity by Block Group [goto top] Block groups are statistically defined geographic areas covering the U.S. wall-to-wall 217,740 areas). The view below shows patterns of economic prosperity, as measured by the median household income (MHI), MHI interval/color patterns are shown in the highlighted layer at left of the map. Click on graphic to view larger version that uses the MHI as a label for each BG. It is easy to see that the MHI for the for four BGs in vicinity of Fairview ES (see pointer in map) vary widely. Choose from hundreds of demographic-economic measures to assess patterns of well-being, age distribution, housing structure and age, educational attainment, housing value, race/origin, employment, language spoken at home among many others. 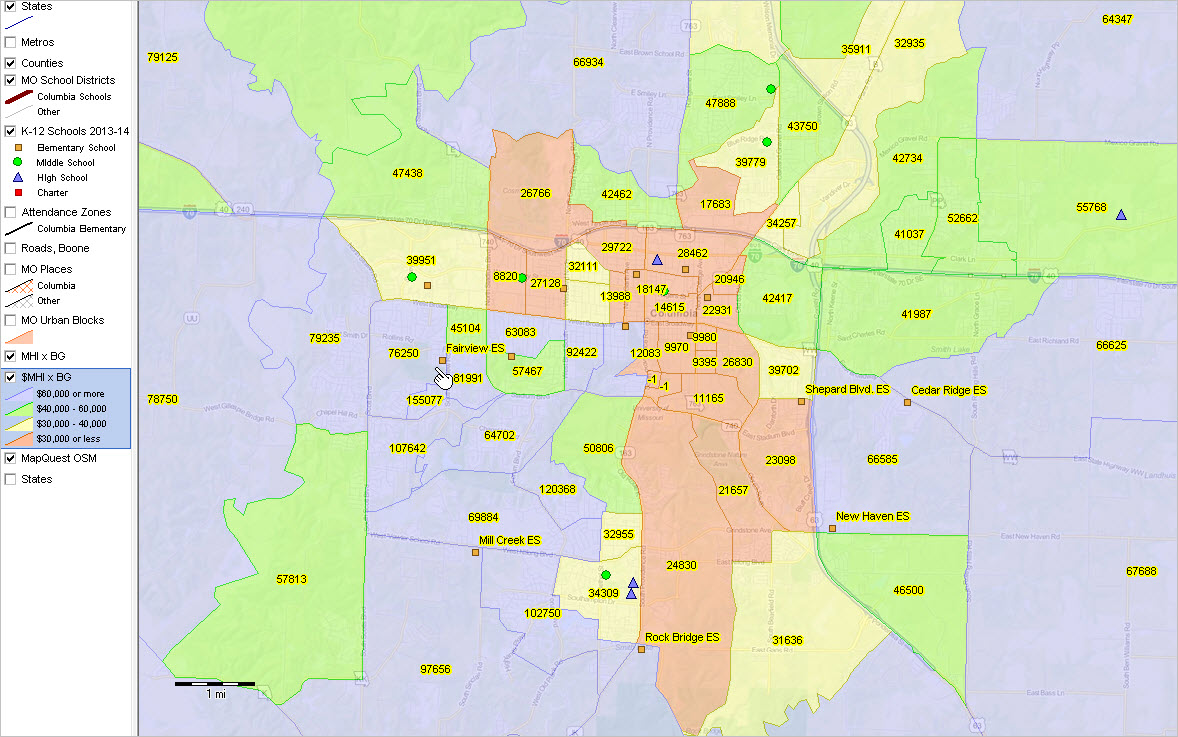 -- click graphic for larger showing details. SiteAnalysis Using Census Block by Age Data [goto top] The next graphic illustrates use of Site Analysis tools to aggregate Census 2010 census block data for a set of block groups in the vicinity of a school. This application builds on the larger view shown in the above graphic. In that view and as described in the above text, there are four block groups (BGs) of interest in the vicinity of Fairview ES. What it the population by single year of age for the sum of the census blocks comprising these four BGs? To get that answer, the Site Analysis tool is used on the census blocks layer/shapefile. 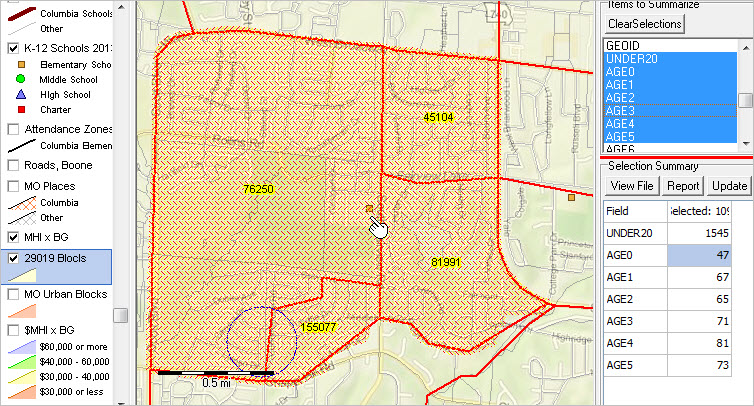 -- click graphic for larger showing details. The cross-hatched areas shown in the above view are the cherry-picked census blocks comprising that area. In this example all blocks in those four block groups have been selected. Using this method, only a subset of blocks might have been selected. The upper right section lists the subject matter items that will be summarized. The lower right section shows the summary -- population by single year of age for the total set of blocks selected. There are 47 persons (as of Census 2010) age 0/under age 1. The visual site analysis tool can be used iteratively to examine differently composed areas. • Selecting only six blocks near the school • Select blocks intersecting a one mile radius from school • Selecting blocks in non-contiguous areas near school -- click graphic for larger showing details. The records selected may be viewed in a table at any stage in a tabular manner by clicking the View File button, shown in the right section of the graphic above. That operation creates a subset file based on the master set of [in this case] census blocks. Selected fields from the extracted data are shown in the table in the following graphic. 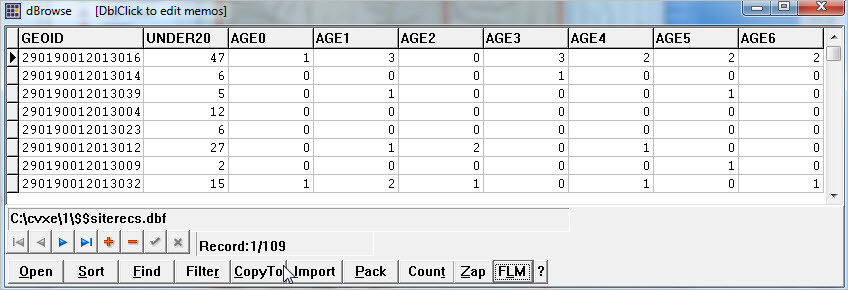 -- click graphic for larger showing details. The Selection Summary (in lower right of SiteAnalysis operation above) automatically refreshes to clipboard each time a summary is computed. The following graphic illustrates how the clipboard content can be pasted into an empty Excel spreadsheet ... and possibly integrated with other data. Of the 109 census blocks selected, there is a Census 2010 population of 47 in the sum of these blocks. 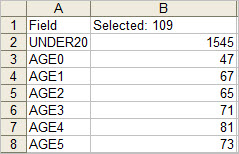 Closing While this ends the review of the preplanned applications, it is the beginning of your steps to use these data and tools for your own analyses. Use these examples to build your own applications focused on your geography/district of interest. Join us in the Data Analytics Lab sessions described below to see related types of data analyses and get answers to you specific questions. Support Using these Resources Learn more about demographic economic data and related analytical tools. Join us in a Data Analytics Lab session. There is no fee for these Web sessions. Each informal session is focused on a specific topic. The open structure also provides for Q&A and discussion of application issues of interest to participants. ProximityOne User Group Join the ProximityOne User Group to keep up-to-date with new developments relating to geographic-demographic-economic decision-making information resources. Receive updates and access to tools and resources available only to members. Use this form to join the User Group. Additional Information ProximityOne develops geographic-demographic-economic data and analytical tools and helps organizations knit together and use diverse data in a decision-making and analytical framework. We develop custom demographic/economic estimates and projections, develop geographic and geocoded address files, and assist with impact and geospatial analyses. Wide-ranging organizations use our software, data and methodologies to analyze their own data integrated with other data. Follow ProximityOne on Twitter at www.twitter.com/proximityone. Contact ProximityOne (888-364-7656) with questions about data covered in this section or to discuss custom estimates, projections or analyses for your areas of interest. |
|
|