Metro Reports -- Extended Geographic- Demographic-Economic -- continuously updated
• example ...
Washington, DC metro
• click link in "Code" column in
interactive table below to view a metro of interest.
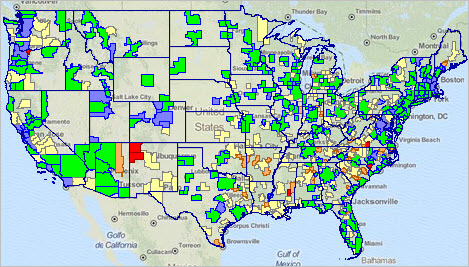
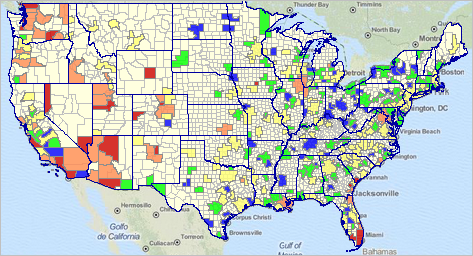
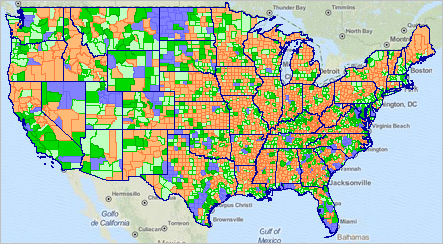
01.15.19 Metro Demographic-Economic Characteristics 2017 annual update; Interactive Tables
..
General Demographics
..
Social Characteristics
..
Economic Characteristics
..
Housing Characteristics
12.31.18 Metro Quarterly Housing Price Index Updates
• 2017Q3 and 2018Q3; quarter to quarter and over year change/trends
• interactive table --
http://proximityone.com/hpi.htm
11.25.18 Metro Regional Economic Information System
• Personal Income by Major Source and related measures
• 2017 annual updates; time series
• integrated into individual profiles (access using above table)
•
http://proximityone.com/reis.htm
09.20.18 Metro Gross Domestic Product (GDP)
• View, rank, compare metros by GDP by industry
• Learn more about how specific metros are changing, how, why and by how much
• Interactive table:
http://proximityone.com/metrogdp.htm
05.07.18. CBSA/Metro Population & Components of Change Updated
... interactive table in this section updated to with annual population & components of change data
... annual data now span 2010-2017; next update April 2019
... see
table below in this section
04.25.18. Metro/County Business Patterns 2016
... tools to examine business establishment patterns by metro/county by type of business
... interactive table & GIS/mapping/geospatial analysis applications
... see
http://proximityone.com/cbp2016.htm
01.15.18 2016 Demographic-Economic Characteristics Interactive Tables
..
General Demographics
..
Social Characteristics
..
Economic Characteristics
..
Housing Characteristics
08.01.17 Metro GDP by Industry
• View, rank, compare metros by GDP by industry
• Learn more about how specific metros are changing, how, why and by how much
• Quarterly and annual GDP by industry
• Interactive table & details:
http://proximityone.com/gdpbyindustry.htm
06.15.17 Metro Trends 2010-2016
• View, rank, compare metros annual population and components of change
• Learn more about how specific metros are changing, how, why and by how much
• View precomputed rank values for total population, population change and %population change
• Interactive table & details:
http://proximityone.com/metrotrends2016.htm
2013 Demographic-Economic Data for 2013 Vintage Metros
October 2014 ...
• For first time ...
2013 ACS demographic-economic data for current vintage CBSAs
• Interactive table & details:
http://proximityone.com/acs2013_metros.htm
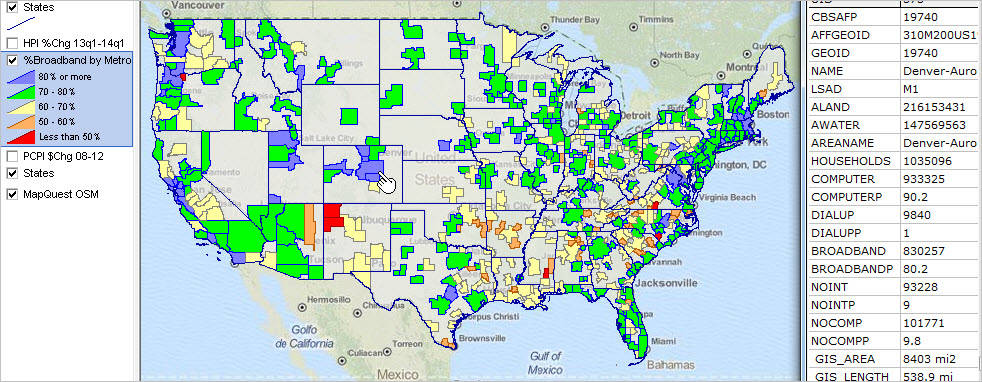
Households by Computer Use & Internet Access -- by Metro
September 2014 ...
• Among the largest metros in 2013, metro total households having broadband Internet access
ranged from 29.5% (Gallup, NM MISA) to 86.0% (San Jose-Sunnyvale-Santa Clara, CA MSA).
• Interactive table & details:
http://proximityone.com/computer_use.htm
 National/State/Metro Quarterly Housing Price Index Updates
New June 2014 -- data for 2014Q1 and quarterly trends
• interactive ranking table --
http://proximityone.com/hpi.htm
Rental Market Conditions by State & Metropolitan Area; 2014 Update
New May 2014 --
http://proximityone.com/metro_rentalmarket_2014.htm
• U.S., states and metros -- interactive housing market characteristics table
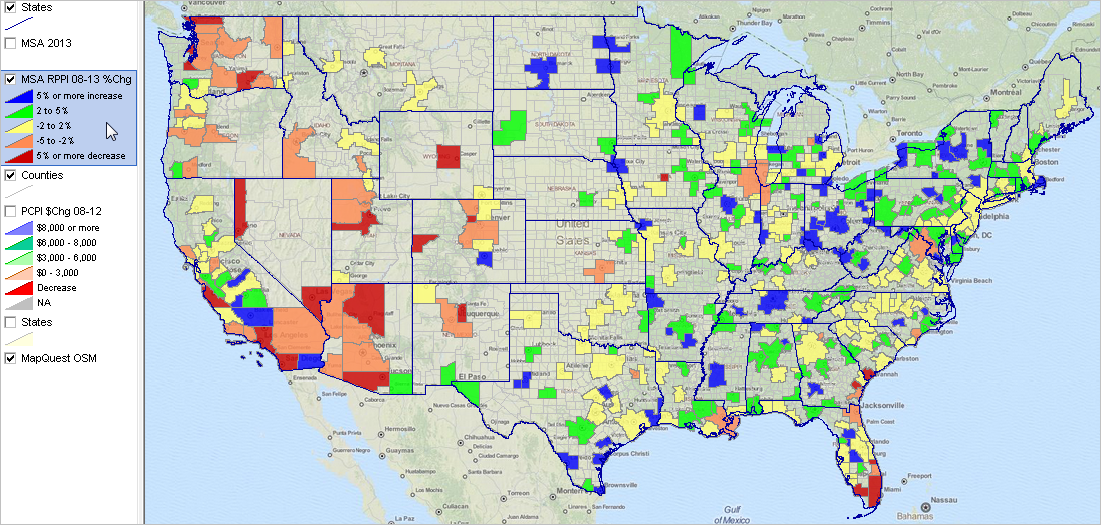
 Metro & State Real Per Capita Personal Income; 2008-12
New April 2014 --
http://proximityone.com/metro_rppi.htm
• interactive table -- view/query/rank/compare
• ready-to-use
GIS resources -- click graphic for larger view & details
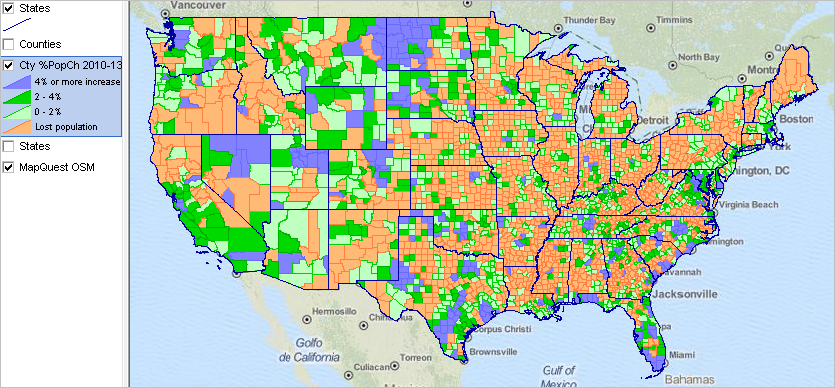
 Metro & County Population Estimates & Components of Change
New March 2014 --
Metro & County Demographic Trends
• latest official estimates; annual data 2010 forward
• interactive table -- view/query/rank/compare
• ready-to-use
GIS resources -- click graphic for larger view & details
 11.21.13. Regional Economic Information System Updates
 -- new estimates November 2013
• personal income and personal income components by county and metro; view data contextually for
Houston Metro
• annual time series updated with new 2011 and 2012 estimates; data based on
2013 vintage metros
• use interactive table to examine per capita personal income trends; all counties & metros - see
http://proximityone.com/reis13
09.21.13. ACS 2012 Demographic-Economic Updates -- new estimates September 2013
• new
American Community Survey (ACS) 2012 1-year estimates
- data based on 2009/10 vintage metros
• use interactive table to examine demographic-economic patterns
- see
http://proximityone.com/metro_acs12.htm
09.18.13. Metro GDP Updates -- new estimates September 2013
• new current-dollar and real GDP annual estimates 20001 to 2012 -- based on 2013 vintage metros.
• use the interactive table to find out how metros of interest compare to one another:
- see
http://proximityone.com/metrogdp.htm
• access these data as a part of an integrated demographic-economic profile using the APIGateway:
- see
http://proximityone.com/cv_apigateway.htm
03.19.13. New Metropolitan Area Component Demographic-Economic Characteristics
• 2013 vintage metros & component areas --
http://proximityone.com/metros2013.htm
- interactive ranking/query table
• metro principal city demographic-economic characteristics --
http://proximityone.com/places.htm
- includes all U.S. cities/places - interactive ranking/query table
• metro component county demographic- economic characteristics --
http://proximityone.com/countytrends.htm
- includes all counties - interactive ranking/query table
03.06.13. New Metropolitan Area Designations
... Effective 2/28/13, the U.S. Office of Management & Budget (OMB) announced revised delineations of
Metropolitan Statistical Areas (MSAs), Micropolitan Statistical Areas (MISAs)
and Combined Statistical Areas (CSAs)
... All Federal agencies producing statistical data for metros are to use these new designations.
... 929 metros (MSAs and MISAs) now exist in the U.S. and Puerto Rico
... 388 MSAs now exist (381 in the U.S. and 7 in Puerto Rico)
... 11 MSAs contain a total of 31 Metropolitan Divisions (MDs)
... 541 MISAs now exist (536 in the U.S. and 5 in Puerto Rico)
... 169 CSAs now exist with their 524 component MSAs and/or MISAs
... 38 New England City and Town Areas (NECTAs) now exist
... 6 Combined NECTAs now exist with their 26 component NECTAs
... see
http://proximityone.com/metro2013.htm
02.28.13. Housing Price Index Updates
... quarterly updated Housing Price Index (HPI) interactive ranking table structure.
... through quarter ending 2012Q4.
... see
http://proximityone.com/hpi.htm.
12.20.12. Metro County Demographic-Economic Ranking Tables
... several hundred (600+) most widely used subject matter items; all states, metros, counties
... based on ACS 2011 and related data; released December 2012
... view/rank/compare metro demographic-economic attributes; develop regional/metro by county profiles
... expanded scope of data and geography compared to 10/8 release - see below
... General Demographics --
http://proximityone.com/us11dp1.htm
... Social Characteristics --
http://proximityone.com/us11dp2.htm
... Economic Characteristics --
http://proximityone.com/us11dp3.htm
... Housing Characteristics --
http://proximityone.com/us11dp4.htm
11.16.12. Metro Age-Gender Demographics Pattern Analysis
... Compare 2000 & 2010 age-gender demographics for any CBSA to any other CBSA.
... Population pyramids plus extended Census 2000 and Census 2010 underlying Excel datasets.
... Core-Based Statistical Areas (CBSA) -- Metro and Micro Statistical Areas.
...
http://proximityone.com/populationpyramids.htm#cbsa
10.08.12. Metro ACS 2011 interactive ranking tables
... New demographic-economic American Community Survey data released September 2012
... All metros/MSAs, U.S., states, counties, cities, congressional districts
... Several hundred most widely used subject matter items
... General Demographics --
http://proximityone.com/acs2011dp1.htm
... Social Characteristics --
http://proximityone.com/acs2011dp2.htm
... Economic Characteristics --
http://proximityone.com/acs2011dp3.htm
... Housing Characteristics --
http://proximityone.com/acs2011dp4.htm
10.04.12. Metro Rental Markets: Median Gross Rent 2008-2011
... extends on
Metro Rental Markets section
... median gross rent for 2008, 2009, 2010, 2011 and change by metro
... compare and rank metros with interactive ranking table
... see
http://proximityone.com/metro_rentalmarket_trends.htm.
05.31.12. Metros Circa 1930
... statistics for metros first developed as of 1910 & 1920 censuses; more similar to today starting with 1930 census.
... 1930 census: 96 'metropolitan districts' each with minimum population of 100,000
and containing one or more central cities of 50,000 or more population.
... see
more about 1930 metros.
04.28.12. Metro Personal Income Time Series Updates
... new estimates of personal income to county level for 2010.
... see
http://proximityone.com/pcpi.htm.
11.29.11. Compare Census 2010 with American Community Survey 2010 1-Year Estimates
... interactive ranking table ... view/rank/query
... all metropolitan statistical areas and other metros with 65,000 population and over
...
http://proximityone.com/acs2010.htm.
10.17.11. Metro Establishments, Employment & Earnings
... interactive ranking table ... view/rank/query
... establishments, employment and earnings by industry by metro.
Annual 2010 .. 2010q1 .. 2010q2 .. 2010q3 .. 2010q4 .. 2011q1
...
http://proximityone.com/metroeee.htm
... click link in table to view detailed E-E-E profile. See
example for Kansas City MSA.
10.12.11. Examining Daytime Population in Metro Component Counties
... use the
feature to query for only those counties in a CBSA/metro of interest.
... See http://proximityone.com/stcty_daytime_population09.htm.
09.30.11. Metropolitan Area Income & Poverty Characteristics: 2009-2010
... nationally, median household income changed from $50,221 in 2009 to $50,046 in 2010.
... percent families in poverty increased from 10.5 to 11.3 percent.
... percent individuals in poverty increased from 14.3 to 15.3.
... use the interactive ranking table to rank/compare/view income characteristics by state and metropolitan area.
... http://proximityone.com/stmetro_income0910.htm.
09.29.11. 2010 Metropolitan Area "Richer Demographics" Datasets Now Available
... 2010 metropolitan area demographic profiles.
... http://proximityone.com/dataresources/guide/acs_2010.htm.
06.13.11. Metro & County Demographic Projections to 2020
... demographic estimates and projections interactive ranking table: analyze metropolitan area patterns and trends.
... estimates and projections reflect Census 2010 results.
... see http://proximityone.com/demographics2020.htm
06.03.11. Analyzing Asian Population, Census 2000-2010, by Metro
... U.S. total population increased from Census 2000 281.4 million to Census 2010 308.7 million (9.7 percent).
... U.S. Asian population increased from 10.2 million to 14.7 million (43.3 percent).
... use interactive ranking table to examine patterns of Asian population by sub-group by metropolitan area.
... see http://proximityone.com/cen2010_asian.htm.
05.03.11. Examining Hispanic Population by Metro/non-Metro
... As of Census 2010, 16.3% of the total U.S. population were of Hispanic Origin.
... Patterns of Hispanic population vary widely by metro and metro component areas.
... use interactive ranking table to examine Hispanic population compared to the total population by metro and other arera.
... see http://proximityone.com/hispanic_demographics.htm.
04.15.11. Metro Census 2010 General Demographics Profiles
... Click on a metro name/link in upper right scroll box to view metro
Census 2010 general demographics profiles.
04.09.11. Metro Gross Domestic Product Patterns & Trends
... view/compare/contrast Gross Domestic Product by metro; national scope interactive ranking table.
... see http://proximityone.com/metrogdp.htm
04.08.11. Metro Area Census 2000-2010 Ranking Table - Updated
... view/compare/contrast metro population and housing.
... Census 2000, Census 2010 and change; national scope interactive ranking table.
... see http://proximityone.com/metros0010.htm
03.28.11. National Scope Metro Area Census 2010 PL Summary File
... examine metros using Census 2010 PL summary file.
... see http://proximityone.com/cen2010_plfile.htm
Earlier ...
• Disability Status by Age by Metro
• Rental Market Conditions by Metro
• Health Insurance Coverage by Metro
• Graying of America by Metro
1930 Census Metropolitan Districts
From the Census Bureau Fifteenth Census of the United States: 1930 Metropolitan Districts report,
"Ninety-six metropolitan districts have been established,
each having an aggregate population of 100,000 or more,
and containing one or more central cities of
50,000 or more inhabitants. No metropolitan district
was established for those cities which did not have in the
central city and surrounding area a population of at least 100,000.
The metropolitan districts are designated by the
name of the central city, or in those cases where the
area includes two or more important cities no one of
which can properly be regarded as the central clominant
city, by the combined names of such cities.
While the aggregate area of the metropolitan districts
is only 1.2 per cent of the total land area of the
United States, the population of these districts is�
nearly 45 per cent of the total population."
Total Population and Area of Metropolitan Districts: 1930 Census
| | Population | Percent | Square Miles | Percent | Pop/SqMi |
| Continental U.S. | 122,775,046 | | | | |
| Total, Metropolitan Districts | 54,753,645 | 100.0 | 36,577.87 | 100.0 | 1,496.9 |
| In central cities | 37,814,610 | 69.1 | 4,596.05 | 12.3 | 8,380.4 |
| Outside central cities | 16,939,035 | 30.9 | 31,981.82 | 87.7 | 528.3 |
The Ninety-Six 1930 Metropolitan Districts: 1920 and 1930 Census Population and Change
| Metro District | 1920 Population | 1930 Population | Change 1920-30 | %Change 1920-30 |
| Akron, OH | 288,371 | 346,681 | 58,310 | 20.22 |
| Albany-Schenectady-Troy, NY | 377,185 | 425,259 | 48,074 | 12.75 |
| Allentown-Bethlehem-Easton, PA | 281,083 | 322,172 | 41,089 | 14.62 |
| Altoona, PA | 103,904 | 114,232 | 10,328 | 9.94 |
| Atlanta, GA | 260,424 | 370,920 | 110,496 | 42.43 |
| Atlantic City, NJ | 64,970 | 102,024 | 37,054 | 57.03 |
| Baltimore, MD | 817,646 | 949,247 | 131,601 | 16.10 |
| Binghamton, NY | 98,703 | 130,005 | 31,302 | 31.71 |
| Birmingham, AL | 288,772 | 382,782 | 94,010 | 32.56 |
| Boston, MA | 2,007,425 | 2,307,897 | 300,472 | 14.97 |
| Bridgeport, CT | 185,580 | 203,969 | 18,389 | 9.91 |
| Buffalo-Niagara, NY | 671,893 | 820,573 | 148,680 | 22.13 |
| Canton, OH | 153,309 | 191,231 | 37,922 | 24.74 |
| Charleston, WV | 73,025 | 108,160 | 35,135 | 48.11 |
| Chattanooga, TN | ... | 168,589 | ... | ... |
| Chicago, IL | 3,271,557 | 4,364,755 | 1,093,198 | 33.42 |
| Cincinnati, OH | 630,896 | 759,464 | 128,568 | 20.38 |
| Cleveland, OH | 935,854 | 1,194,989 | 259,135 | 27.69 |
| Columbus, OH | 267,413 | 340,400 | 72,987 | 27.29 |
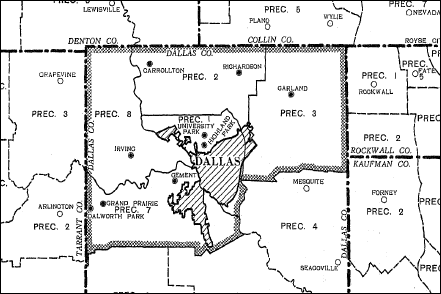
| Dallas, TX | 195,565 | 309,658 | 114,093 | 58.34 |
| Davenport, IA | 144,669 | 154,491 | 9,822 | 6.79 |
| Dayton, OH | 189,360 | 251,928 | 62,568 | 33.04 |
| Denver, CO | 280,332 | 330,761 | 50,429 | 17.99 |
| Des Moines, IA | 140,241 | 160,963 | 20,722 | 14.78 |
| Detroit, MI | 1,252,909 | 2,104,764 | 851,855 | 67.99 |
| Duluth, MN | 153,213 | 155,390 | 2,177 | 1.42 |
| El Paso, TX | 94,210 | 118,461 | 24,251 | 25.74 |
| Erie, PA | 109,889 | 129,817 | 19,928 | 18.13 |
| Evansville, IN | 102,791 | 123,130 | 20,339 | 19.79 |
| Flint, MI | 102,958 | 179,939 | 76,981 | 74.77 |
| Fort Wayne, IN | 94,696 | 126,558 | 31,862 | 33.65 |
| Fort Worth, TX | 129,744 | 174,575 | 44,831 | 34.55 |
| Grand Rapids, MI | 154,284 | 207,154 | 52,870 | 34.27 |
| Harrisburg, PA | 144,817 | 161,672 | 16,855 | 11.64 |
| Hartford, CT | 381,875 | 471,185 | 89,310 | 23.39 |
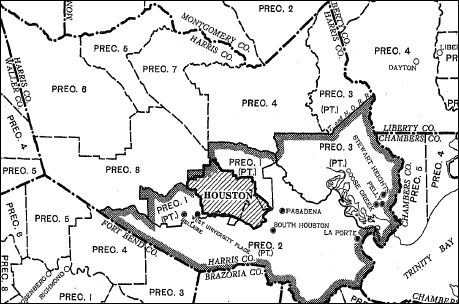
| Houston, TX | ... | 339,216 | ... | ... |
| Huntington, WV-Ashland, KY | 114,878 | 163,367 | 48,489 | 42.21 |
| Indianapolis, IN | 343,868 | 417,685 | 73,817 | 21.47 |
| Jacksonville, FL | ... | 148,713 | ... | ... |
| Johnstown, PA | 142,044 | 147,611 | 5,567 | 3.92 |
| Kansas City, MO-KS | 479,893 | 608,186 | 128,293 | 26.73 |
| Knoxville, TN | 95,835 | 135,714 | 39,879 | 41.61 |
| Lancaster, PA | 105,482 | 123,156 | 17,674 | 16.76 |
| Little Rock, AR | 88,454 | 113,137 | 24,683 | 27.90 |
| Los Angeles, CA | ... | 2,318,526 | ... | ... |
| Louisville, KY | 330,048 | 404,498 | 74,450 | 22.56 |
| Lowell-Lawrence, MA | 342,706 | 332,028 | -10,678 | -3.12 |
| Memphis, TN | ... | 276,128 | ... | ... |
| Miami, FL | ... | 132,189 | ... | ... |
| Milwaukee, WI | 553,118 | 743,414 | 190,296 | 34.40 |
| Minneapolis-St. Paul, MN | 680,344 | 832,258 | 151,914 | 22.33 |
| Nashville, TN | 156,238 | 209,422 | 53,184 | 34.04 |
| New Haven, CT | 258,012 | 293,724 | 35,712 | 13.84 |
| New Orleans, LA | ... | 494,877 | ... | ... |
| New York-NE NJ | 8,505,404 | 10,901,424 | 2,396,020 | 28.17 |
| Norfolk-Portsmouth-Newport, VA | 208,086 | 273,233 | 65,147 | 31.31 |
| Oklahoma City, OK | 100,773 | 202,163 | 101,390 | 100.61 |
| Omaha, NE - Council Bluffs, IA | 238,440 | 273,851 | 35,411 | 14.85 |
| Peoria, IL | 106,238 | 144,732 | 38,494 | 36.23 |
| Philadelphia, PA | 2,452,076 | 2,847,148 | 395,072 | 16.11 |
| Pittsburgh, PA | 1,698,646 | 1,953,688 | 255,042 | 15.01 |
| Portland, OR | ... | 378,728 | ... | ... |
| Providence, RI-Fall River-New Bedford, MA | 878,708 | 963,686 | 84,978 | 9.67 |
| Racine-Kenosha, WI | 111,292 | 133,463 | 22,171 | 19.92 |
| Reading, PA | 144,496 | 170,486 | 25,990 | 17.99 |
| Richmond, VA | 194,890 | 220,513 | 25,623 | 13.15 |
| Roanoke, VA | 72,034 | 103,120 | 31,086 | 43.15 |
| Rochester, NY | 328,925 | 398,591 | 69,666 | 21.18 |
| Rockford, IL | 78,616 | 103,204 | 24,588 | 31.28 |
| Sacramento, CA | 84,709 | 126,995 | 42,286 | 49.92 |
| St. Louis, MO-IL | 1,071,529 | 1,293,516 | 221,987 | 20.72 |
| Salt Lake City, UT | 152,748 | 184,451 | 31,703 | 20.76 |
| San Antonio, TX | 189,392 | 279,271 | 89,879 | 47.46 |
| San Diego, CA | ... | 181,020 | .../td> | ... |
| San Francisco-Oakland, CA | 964,495 | 1,290,094 | 325,599 | 33.76 |
| San Jose, CA | ... | 103,428 | ... | ... |
| Savannah, GA | 100,032 | 105,431 | 5,399 | 5.40 |
| Scranton-Wilkes-Barre, PA | 590,208 | 652,313 | 62,105 | 10.52 |
| Seattle, WA | 350,678 | 420,663 | 69,985 | 19.96 |
| South Bend, IN | 92,145 | 146,589 | 54,444 | 59.09 |
| Spokane, WA | 118,178 | 128,798 | 10,620 | 8.99 |
| Springfield-Holyoke, MA | 359,778 | 398,991 | 39,213 | 10.90 |
| Syracuse, NY | 200,868 | 245,015 | 44,147 | 21.98 |
| Tacoma, WA | 127,251 | 146,771 | 19,520 | 15.34 |
| Tampa-St. Petersburg, FL | ... | 169,010 | ... | ... |
| Toledo, OH | 275,062 | 348,530 | 73,468 | 26.71 |
| Trenton, NJ | 162,331 | 190,219 | 27,888 | 17.18 |
| Tulsa, OK | 104,379 | 183,207 | 78,828 | 75.52 |
| Utica, NY | 174,784 | 190,918 | 16,134 | 9.23 |
| Washington, DC | 524,469 | 621,059 | 96,590 | 18.42 |
| Waterbury, CT | 129,251 | 140,575 | 11,324 | 8.76 |
| Wheeling, WV | 170,479 | 190,623 | 20,144 | 11.82 |
| Wichita, KS | 75,978 | 119,174 | 43,196 | 56.85 |
| Wilmington, DE | 152,302 | 163,592 | 11,290 | 7.41 |
| Worcester, MA | 276,755 | 305,293 | 28,538 | 10.31 |
| Youngstown, OH | 283,521 | 364,560 | 81,039 | 28.58
|
Notes: "..." indicates data not available; unable to tabulate data for same area as defined for 1930.
Dallas, TX 1930 Metropolitan District (city: diagonal pattern; district: cross-hatched boundary)
Houston, TX 1930 Metropolitan District (city: diagonal pattern; district: cross-hatched boundary)