|
|
|
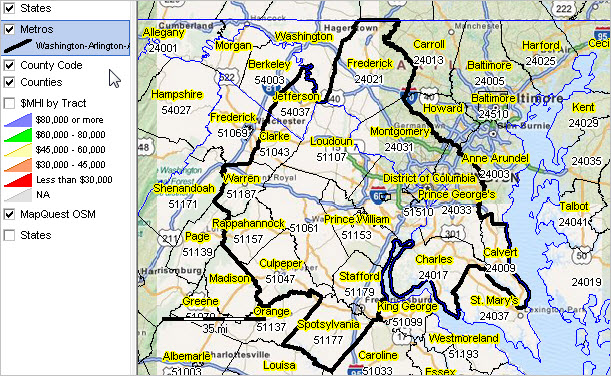
-- Fairfax County, VA Examining the patterns and characteristics of the Citizen Voting Age Population (CVAP) for small geographic areas can create insights into areas where the voting age population can be further engaged. In many areas, further engagement of the voting age population can mitigate or overcome gerrymandered congressional and state legislative districts. More in general CVAP analysis can lead to improved voting age population engagement in voting and the political representation process. The CVAP population by block group is reviewed in this section in context of other political/statistical geography and demographics for the Fairfax, VA geographic area. Adjacent to Washington, DC, Fairfax County, VA with 2017 population of 1,150,439 is the largest among all 24 counties comprising the Washington, DC metro. The County intersects with 9 Virginia Senate state legislative districts, 15 Virginia House of Delegates state legislative districts and 3 115th Congressional Districts. This section illustrates use of data analytics methods and tools to examine geographic-demographic-economic characteristics of Fairfax County. Multi-sourced data are integrated using GIS, Outlook2030 and related resources. The focus is primarily on sub-county areas and analysis of socioeconomic characteristics, political geography and voting patterns. Views, data and analytics presented here are available for any county/area. Join in ... see more about Congressional District-State Legislative Districts Group (CDSLD). The Census 2010 population of Fairfax County, VA was 1,081,726 (2,767 persons per square mile). See more about this county in context of other counties and areas using this interactive table. See how the County has changed since 2010; view projections to 2030 by single year of age and age group. Fairfax County demographic-economic characteristics • Fairfax County, VA -- 1-year estimates • Fairfax County, VA -- 5-year estimates Topics • Congressional District-State Legislative Districts Group (CDSLD) • 01 Patterns of Economic Prosperity by Census Tract • 02 Virginia State House District 44 -- Patterns of Economic Prosperity by Neighborhood • 03 115th Congressional Districts; Fairfax County Area • 04 VA State Legislative Districts - Upper/Senate; Fairfax County Area • 05 VA State Legislative Districts - Lower/House; Fairfax County Area • 06 Patterns of Economic Prosperity by Census Tract with Congressional Districts • 07 Citizen Voting Age Population by Block Group • 08 Drill-down View of State Legislative District with Street Detail • 09 Fairfax County Voting Districts/Precincts • 10 Voting District Drill-Down with Census Block Demographics • 11 Voting Districts & Congressional Districts VA SLD House 11 - Roanoke Area • vah011a VA SLD H011 Base View • vah011b VA SLD H011 Base with Primary Roads • vah011c VA SLD H011 Base with Cities/Places • vah011d VA SLD H011 Base with Patterns of Economic Prosperity Fairfax County Patterns of Economic Prosperity by Census Tract 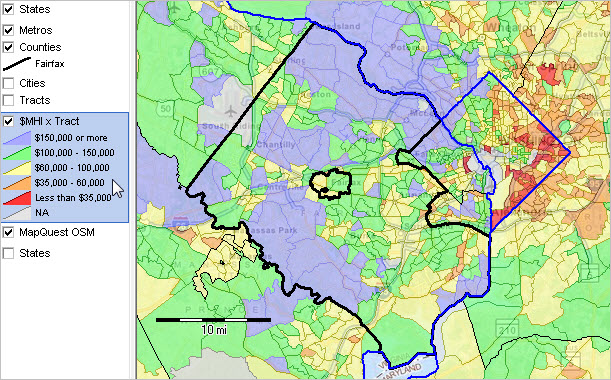 ... View developed using CV XE GIS and related GIS project. Virginia State House District 44 -- goto top The following graphic shows patterns of economic prosperity (median household income as labels) by block group in context of VA state house districts (bold black outline with label). District code 51044 refer to state (51) house district 44. See more about this state legislative district below.  ... Click graphic for larger view. View developed using CV XE GIS and related GIS project. 115th Congressional Districts; Fairfax County Area -- goto top The following graphic shows 115th Congressional District in the Fairfax County area (counties show with brown semi-transparent boundary) . See more about 115th Congressional Districts. Blue cross-hatched areas Democrat incumbent; Red cross-hatched areas Republican incumbent; Click graphic for larger view that shows incumbent name and map legend details. See more about state legislative districts.  ... View developed using CV XE GIS and related GIS project. VA State Legislative Districts - Upper/Senate; Fairfax County Area -- goto top The following graphic shows VA State Legislative Districts (Upper/Senate) in the Fairfax County area (counties show with brown semi-transparent boundary). Blue cross-hatched areas Democrat incumbent; Red cross-hatched areas Republican incumbent; Click graphic for larger view that shows incumbent name and map legend details. See more about state legislative districts.  ... View developed using CV XE GIS and related GIS project. VA State Legislative Districts - Lower/House; Fairfax County Area -- goto top The following graphic shows VA State Legislative Districts (Lower/House) in the Fairfax County area (counties show with brown semi-transparent boundary). Blue cross-hatched areas Democrat incumbent (Jan 2018 session); Red cross-hatched areas Republican incumbent; Click graphic for larger view that shows incumbent name and map legend details. See more about state legislative districts.  ... View developed using CV XE GIS and related GIS project. Patterns of Economic Prosperity by Census Tract with Congressional Districts -- goto top The following graphic shows patterns of economic prosperity by census tract in the Fairfax County area. Click graphic for larger view that shows congressional district boundaries and map legend details. See more about census tracts.  ... View developed using CV XE GIS and related GIS project. Citizen Voting Age Population by Block Group -- goto top The following graphic shows patterns of Citizen Voting Age Population (CVAP) by block group in the Fairfax County area. Click graphic for larger view that shows map legend details. See more about CVAP by block group.  ... View developed using CV XE GIS and related GIS project. Drill-down View of State Legislative District -- goto top The following graphic shows a zoom in to VA house state legislative 44 in the Fairfax County area (see interstate to orient). Blue cross-hatched areas Democrat incumbent (Jan 2018 session); Red cross-hatched areas Republican incumbent; Click graphic for larger view that shows incumbent name and map legend details. See more about state legislative districts. ... View developed using CV XE GIS and related GIS project. Fairfax County Voting Districts/Precincts -- goto top The following view uses the same Fairfax County GIS project to examine voting districts in context of neighborhood economic prosperity. This view shows median household income by census tract. Using the GIS layer editor, different types of demographic-economic subject matter (such as educational attainment, housing value, language spoken at home ...) could be used. 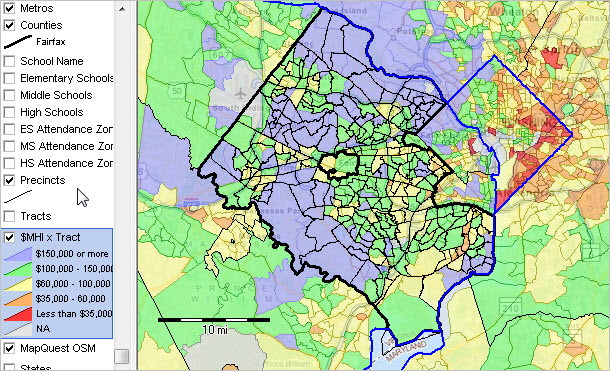 ... Click graphic for larger view. View developed using CV XE GIS. Voting District Drill-Down with Census Block Demographics -- goto top The following view uses the same Fairfax County GIS project to examine census block (about census block) demographics by voting district. The graphic shows a zoom-in view focused on the Sherwood voting district. Using the CV XE GIS site analysis tool, all census blocks are selected within the Sherwood VTD (cross-hatched). A subset of blocks could have been selected to examine just part of the VTD. The table to the right of the map shows the aggregated total population and housing units for this VTD. As of Census 2010 there were 1,380 population in this VTD. Other demographic attributes, such as population by age, gender, or race/origin could be integrated into the shapefile using data sourced from Census 2010 Summary File 1 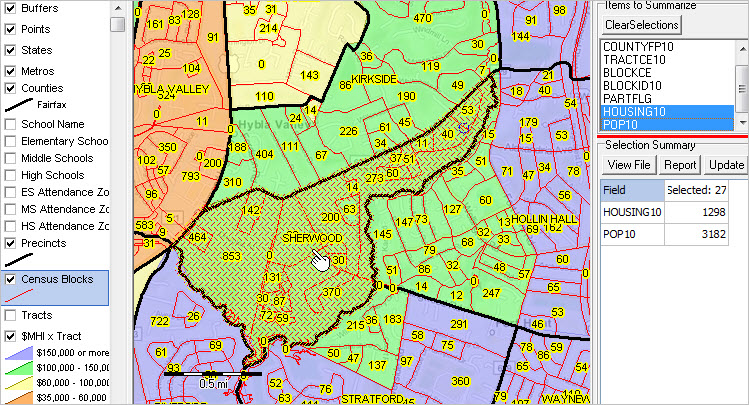 ... Click graphic for larger view. ... View developed using CV XE GIS. Map your own districts of interest. There are 27 census blocks that comprise the Sherwood VTD. Using the View File button in the above operation, these 27 census block records can be viewed using the CV XE GIS dBrowser tool. A partial view of the records is shown below. This file can be exported for use with other software. 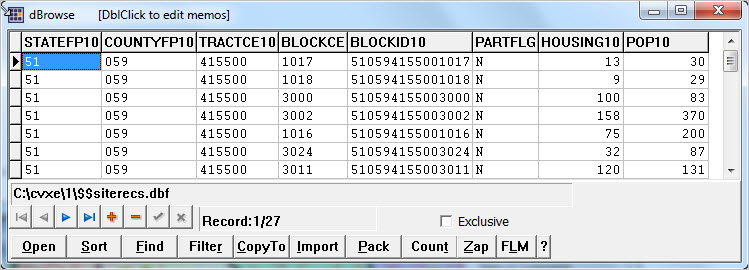 ... Click graphic for larger view. ... View developed using CV XE GIS. Map your own districts of interest. Additional School/Attendance Zone/VTD/Census Block Analysis 1. Using the GIS project, the attendance zone and schools layers can be checked/shown. School locations can be examined by VTD; VTDs intersecting attendance zones can be examined. 2. What was the size of the voting age population? The citizen voting age population? These attributes could be examined at the block group level of geography, not reviewed here. See additional information on the citizen voting age population. Voting Districts & Congressional Districts -- goto top The following view shows Fairfax County voting districts in context of Virginia Congressional District 08 (bold red boundary). Among all congressional districts only VA CD 08 is coterminous with Fairfax County. All others include parts of other counties. 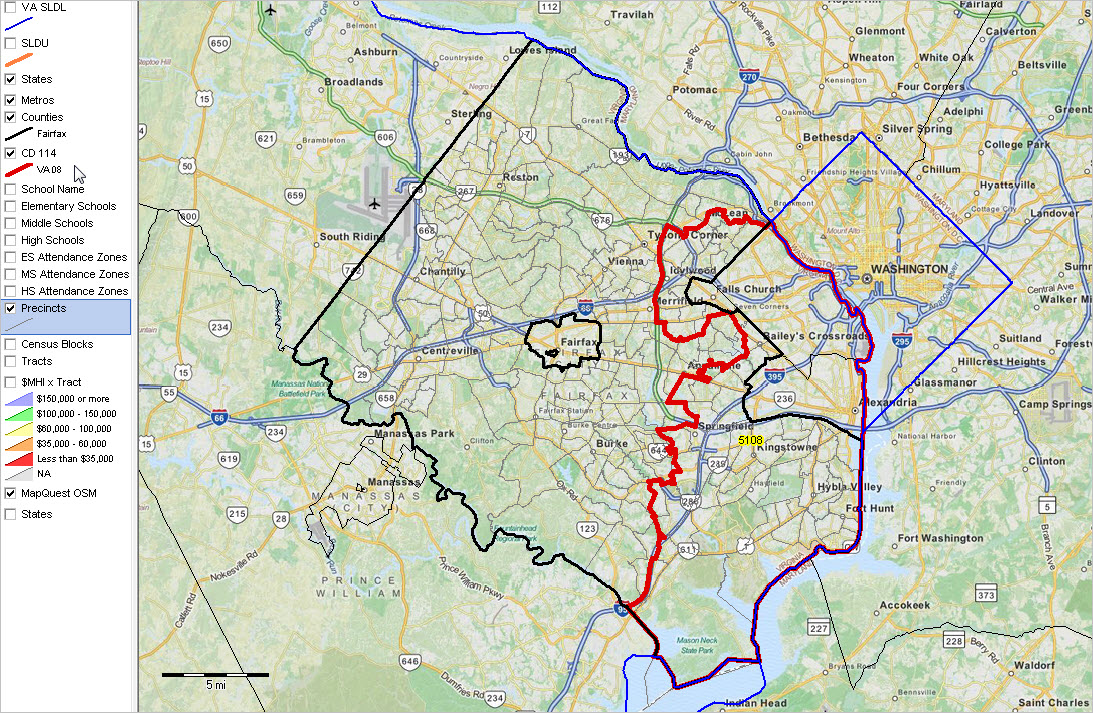 ... Click graphic for larger view. View developed using CV XE GIS. VA SLD H011 Base -- goto top Roanoke area; VA SLD H011 and vicinity; CD115 shown with red bold boundaries - SLD - house shown with black boundaries, SLDL code white boxed label - SLDL cross-hatch pattern colored by incumbent party (2018 session) - urban area shown with salmon fill pattern; Click graphic for larger view; expand browser to full window.  ... View developed using CV XE GIS and related GIS project. VA SLD H011 Base with Primary Roads -- goto top Roanoke area; VA SLD H011 and vicinity; CD115 shown with red bold boundaries - SLD - house shown with black boundaries, SLDL code white boxed label - SLDL cross-hatch pattern colored by incumbent party (2018 session) - urban area shown with salmon fill pattern; - adds primary roads to base view Click graphic for larger view; expand browser to full window.  ... View developed using CV XE GIS and related GIS project. VA SLD H011 Base with Cities/Places -- goto top Roanoke area; VA SLD H011 and vicinity; CD115 shown with red bold boundaries - SLD - house shown with black boundaries, SLDL code white boxed label - urban area shown with salmon fill pattern; - adds cities/places to base view; Roanoke city black cross-hatch pattern Click graphic for larger view; expand browser to full window.  ... View developed using CV XE GIS and related GIS project. VA SLD H011 Base - Patterns of Economic Prosperity -- goto top Roanoke area; VA SLD H011 and vicinity; CD115 shown with red bold boundaries - SLD - house shown with black boundaries, SLDL code white boxed label - adds patterns of median household income by census tract to base view Click graphic for larger view; expand browser to full window. See more about census tracts.  ... View developed using CV XE GIS and related GIS project. Support Using these Resources [goto top] Learn more about demographic economic data and related analytical tools. Join us in a Data Analytics Lab session. There is no fee for these Web sessions. Each informal session is focused on a specific topic. The open structure also provides for Q&A and discussion of application issues of interest to participants. ProximityOne User Group [goto top] Join the ProximityOne User Group to keep up-to-date with new developments relating to geographic-demographic-economic decision-making information resources. Receive updates and access to tools and resources available only to members. Use this form to join the User Group. Additional Information ProximityOne develops geodemographic-economic data and analytical tools and helps organizations knit together and use diverse data in a decision-making and analytical framework. We develop custom demographic/economic estimates and projections, develop geographic and geocoded address files, and assist with impact and geospatial analyses. Wide-ranging organizations use our tools (software, data, methodologies) to analyze their own data integrated with other data. Follow ProximityOne on Twitter at www.twitter.com/proximityone. Contact us (888-364-7656) with questions about data covered in this section or to discuss custom estimates, projections or analyses for your areas of interest. |
|
|