
|
|
|
.. examining Chicago-Naperville-Elgin, IL-IN-WI metropolitan area dynamics: • How will the market for single family homes change over the next 5 years? 20 years? • How does economic prosperity in the Chicago metro compare to others? • What are the patterns in metro rental income and homeownership/vacancy rates? • How do patterns manifest themselves in different ways by county/neighborhood? • How are demographic-economic characteristics trending? We examine these types of topics in this section. Stakeholders can replicate applications reviewed here for this and other metros using ProximityOne resources. Metropolitan areas include approximately 94 percent of the U.S. population -- 85 percent in metropolitan statistical areas (MSAs) and 9 percent in micropolitan statistical areas (MISAs). Of 3,143 counties in the United States, 1,167 are in the 381 MSAs in the U.S. and 641 counties are in the 536 MISAs (1,335 counties are in non-metro areas). Focus on Chicago-Naperville-Elgin, IL-IN-WI MSA This section is focused on the Chicago-Naperville-Elgin, IL-IN-WI MSA; Core-Based Statistical Areas (CBSA) 16980. It is not intended to be a study of the metro but rather illustrate how relevant decision-making information (DMI) resources can be brought together to examine patterns and change and develop insights. The data, tools and methods can be applied to any metro. The Chicago-Naperville-Elgin, IL-IN-WI MSA is shown in the graphic below. The 14-county metropolitan statistical area is shown with bold brown boundary. Chicago city appears with black boundary. The color pattern shows a measure of economic prosperity (median household income: MHI) by census tract.  See color/income intervals in legend at lower left of map view. Click graphic for larger view. Map developed using CV XE GIS. ... See alternative view showing metro counties with names as labels and bold boundaries. ... Develop variations of this map view using the Mapping Illinois Neighborhood Patterns GIS resources. Metro-County Geographic-Demographic Structure The Census 2010 population of the metro was 9,461,105 (3rd largest in the U.S.) compared 9,537,289 (3rd largest in the U.S.) based on the 2013 estimate. See interactive table to examine other metros in a similar manner. Click here to view a metro by county profile for the Chicago metro. Click the county component links below to view annual county population estimates and components of change. • Cook, IL (17031) • DeKalb, IL (17037) • DuPage, IL (17043) • Grundy, IL (17063) • Kane, IL (17089) • Kendall, IL (17093) • Lake, IL (17097) • McHenry, IL (17111) • Will, IL (17197) • Jasper, IN (18073) • Lake, IN (18089) • Newton, IN (18111) • Porter, IN (18127) • Kenosha, WI (55059) Use this interactive table to view demographic attributes of these counties and rank/compare with other counties. See related county trends main section and county demographic-economic profiles. Population Pyramids & Age-Cohort Patterns The graphic below shows the Census 2010 Cook County, IL population pyramid. Click graphic to view as HTML section with related Census 2010 age-gender population distribution. Cook County, IL; Census 2010; Total population 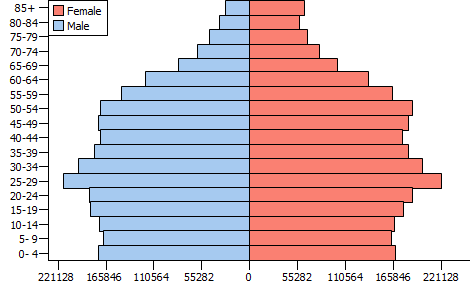 Use ChartGraphics examine population by age-gender-race/origin for any county. County Population Projections to 2020 and Beyond The following view shows counties in the metro area. Counties are labeled with name; bar charts show Census 2000, Census 2010 and the ProximityOne projection to 2020. The CV XE GIS identify tool (see pointer) is used to show a mini-profile for one county. Kendall County, IL is projected to change from 115,206 as of Census 2000 to 173,343 in 2050. See about USA TODAY diversity analyses, 1960-2060, using ProximityOne projections. 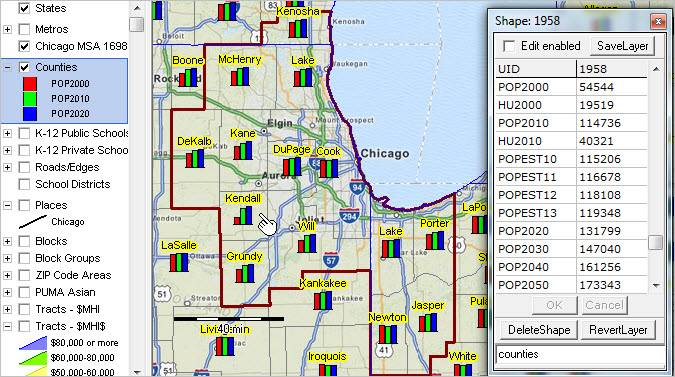 Click graphic for larger view. Map developed using CV XE GIS. Diversity by Neighborhood in the Chicago Region Diversity Patterns Neighborhood/Census Tract Census tracts are colored based on value of the diversity index. See color patterns assigned based on diversity index values as shown in legend at left of the map. Blue tracts are most diverse; red tracts are least diverse. Tracts shown with black cross-hatched pattern are tracts with 50-percent or more Hispanic population. See more about neighhborhood diversity in the Chicago area. 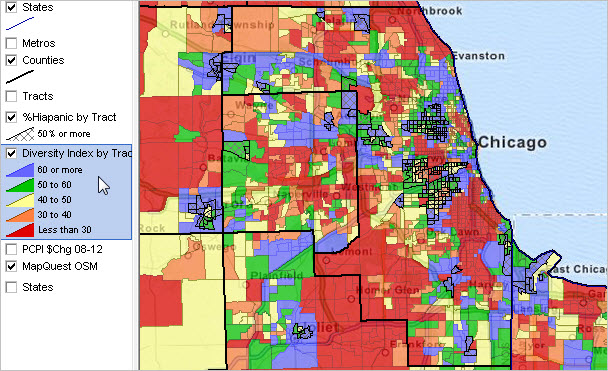 Click graphic for larger view. Map developed using CV XE GIS. Metro Demographic-Economic Characteristics In 2012, the metro median household income was $59,261, percent high school graduates 86.8%, percent college graduates 34.8% and 14.5% in poverty. Use the following U.S.-state-metro interactive table to view/compare/rank compare this metro with other areas: • General Demographics -- http://proximityone.com/usstcbsa12dp1.htm • Social Characteristics -- http://proximityone.com/usstcbsa12dp2.htm • Economic Characteristics -- http://proximityone.com/usstcbsa12dp3.htm • Housing Characteristics -- http://proximityone.com/usstcbsa12dp4.htm Housing Characteristics & Rental Market As shown in the graphic below, 32.5% of the Chicago metro occupied housing units are renter occupied. See the housing characteristics interactive table for more detail about the housing market. 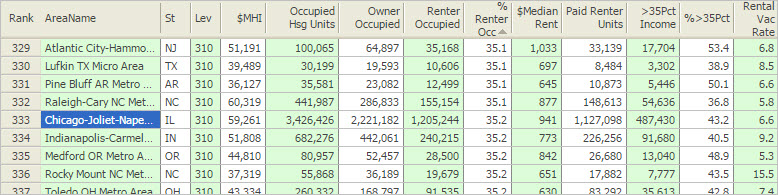 Click graphic for larger view. See detail and full interactive table. Metro Principal Cities There are 10 principal cities in this metro. Click link to view profile for the metro principal cities. • Arlington Heights • Chicago • Des Plaines • Elgin • Evanston • Hoffman Estates • Naperville • Schaumburg • Skokie • Gary See profile for other Illinois cities -- Illinois Community Profiles ... more about the America's Communities Program. View more about all cities/places in the places interactive table and places demographic-economic profiles. Drill-down Analysis The following view illustrates how a set of block groups in Chicago can be visually selected and analyzed using site analysis tools. The cross-hatched areas are 14 block groups in a study area that were visually selected using the mouse. A mini-profile in the lower right grid shows the 14 area aggregate for selected race origin items. The total population for these 14 block groups is 19,979. Perform this type of operation for any set of block groups for wide-ranging demographic-economic measures. 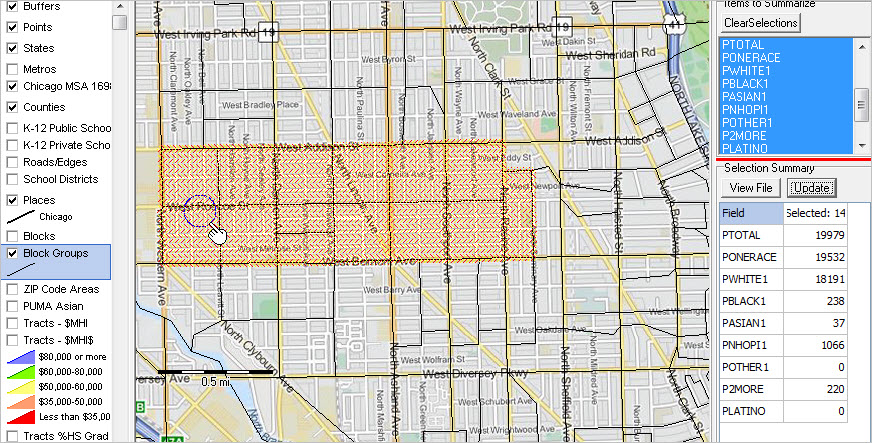 Click graphic for larger view. Developed using CV XE GIS. Click the View File button, the selected 14 block group records are shown in the grid below. Optionally save and output these block group records for further analysis. 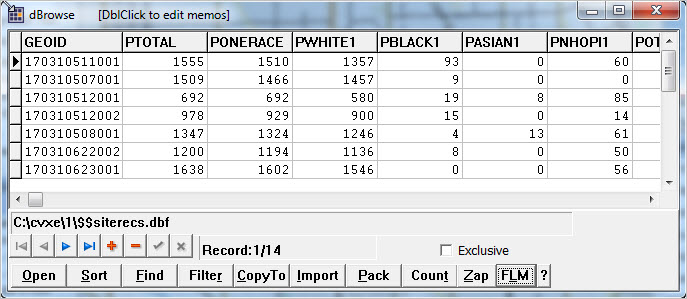 Click graphic for larger view. Developed using CV XE GIS. About Metropolitan Areas and Principal Cities
Metropolitan Areas are designated by OMB ("Standards for Delineating Metropolitan and Micropolitan Statistical Areas") based
mainly on Census Bureau-sourced data.
Metropolitan areas are defined as Metropolitan Statistical Areas (MSA) and Micropolitan Statistical Areas (MISA).
MSAs and MISAs are also referred to a Core-Based Statistical Areas (CBSAs).
Contiguous CBSAs are defined as Combined Statistical Areas (CSA).
By definition, metropolitan areas are comprised of one or more contiguous counties. Metropolitan areas are not single cities and typically include many cities. Metropolitan areas are comprised of urban and rural areas and often have large expanses of rural territory. A business and demographic-economic synergy exists within each metro; metros often interact with adjacent metros. The demographic-economic make-up of metros vary widely and change often. See more about metros. Principal Cities. The largest city in each metropolitan or micropolitan statistical area is designated a "principal city." Principal cities are designated by OMB based on Census-sourced data. Additional cities qualify as principal cities if specified requirements are met concerning population size and employment. The title of each metropolitan or micropolitan statistical area consists of the names of up to three of its principal cities and the name of each state into which the metropolitan or micropolitan statistical area extends. Titles of metropolitan divisions also typically are based on principal city names but in certain cases consist of county names. One or more principal cities are designated within each Metropolitan Statistical Area (MSA) and Micropolitan Statistical Area (MISA). The term "principal city" is defined in the OMB "Standards for Delineating Metropolitan and Micropolitan Statistical Areas." A principal city is an OMB designation applied to one or more incorporated places and/or census designated places (CDPs). The OMB standards designate a Principal City (or Cities) of a Core-Based Statistical Area (CBSA) as determined by: a) The largest incorporated place with a 2010 Census population of at least 10,000 in the CBSA or, if no incorporated place of at least 10,000 population is present in the CBSA, the largest incorporated place or census designated place in the CBSA; and b) Additional places with 2010 Census population of at least 250,000 or in which 100,000 or more persons work; and c) Additional places with 2010 Census population of 50,000-250,000, and number of workers working in the place meets or exceeds the number of workers living in the place; and d) Additional places with 2010 Census population of 10,000-50,000, and at least one-third the population size of the largest place, and in which the number of workers working in the place meets or exceeds the number of workers living in the place. Support Using these Resources Learn more about demographic economic data and related analytical tools. Join us in a Decision-Making Information Web session. There is no fee for these one-hour Web sessions. Each informal session is focused on a specific topic. The open structure also provides for Q&A and discussion of application issues of interest to participants. ProximityOne User Group Join the ProximityOne User Group to keep up-to-date with new developments relating to geographic-demographic-economic decision-making information resources. Receive updates and access to tools and resources available only to members. Use this form to join the User Group. There is no fee. Additional Information ProximityOne develops geographic-demographic-economic data and analytical tools and helps organizations knit together and use diverse data in a decision-making and analytical framework. We develop custom demographic/economic estimates and projections, develop geographic and geocoded address files, and assist with impact and geospatial analyses. Wide-ranging organizations use our tools (software, data, methodologies) to analyze their own data integrated with other data. Follow ProximityOne on Twitter at www.twitter.com/proximityone. Contact ProximityOne (888-364-7656) with questions about data covered in this section or to discuss custom estimates, projections or analyses for your areas of interest. |
|
|