
|
|
|
Examining America's 10 Largest Urbanized Areas
.. why it matters .. among other reasons, these 10 areas have 24% of the total U.S. population. Three have increased by more than 20% in the past 5 years. Learn about the trends and geodemographic patterns. More than 80-percent of America's population is urban, but far more than 80-percent of America's geography is rural. Census 2010 shows that America's urban population increased by 12.1 percent from 2000 to 2010, compared to the national overall growth rate of 9.7 percent. Urban areas now account for 80.7 percent of the U.S. population, compared to 79.0 percent in 2000. This section presents visual/map views for each of America's 10 largest urbanized areas based on 2016 population. These 10 urbanized areas had a total 2016 population of 77.4 million of the total U.S. population of 323.1 million (24.0%). See about urban area definition/classification below in this section. The geodemographic relationships vary widely between the urbanized areas (UAs). Some, such as Miami, comprise most or all of the urban area within the corresponding metropolitan statistical area. Others, such as Philadelphia, are nested within a mix of adjacent urban areas interspersed with rural areas. Among other things, these different geodemographic structures reflect how planning, needs assessment and market development vary widely from associated metro-to-metro. These data show the importance and need to consider the urban/rural population distribution even in the largest metros. America's 10 Largest Urbanized Areas The following table shows the largest 10 Urbanized Areas (UAs) based on the American Community Survey 2011 and 2016 1-year estimates (ACS2016) and change over the period. UAs are sorted in descending order based on the 2016 population estimate. Note that Miami and Atlanta moved up. Click a link in the table to view selected UA.
Map Views Each graphic shows the designated urbanized area in a darker salmon color fill pattern, associated metropolitan statistical area with bold brown boundary, and other urban areas with a lighted shade of salmon fill color, counties black boundaries and yellow labels. The ACS 2016 UA population is shown as a white label under the UA name. 1. New York UA - goto top New York-Newark-Jersey City, NY-NJ-PA MSA Situation and Outlook Report 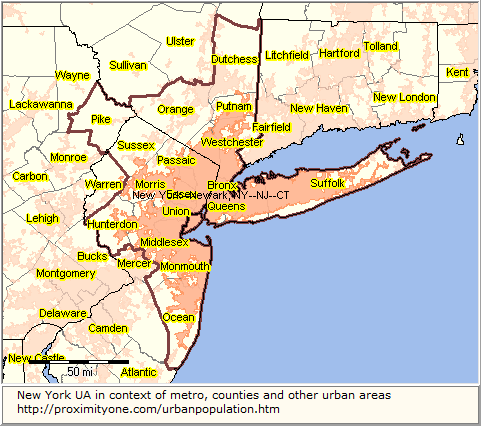 ... View developed using CV XE GIS. 2. Los Angeles UA - goto top Los Angeles-Long Beach-Anaheim, CA MSA Situation and Outlook Report  ... View developed using CV XE GIS. 3. Chicago UA - goto top Chicago-Naperville-Elgin, IL-IN-WI MSA Situation and Outlook Report 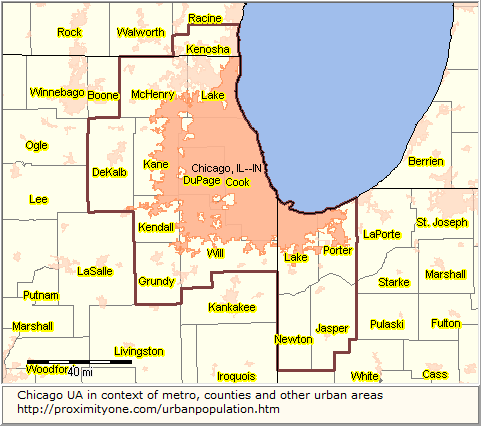 ... View developed using CV XE GIS. 4. Miami UA - goto top Miami-Fort Lauderdale-West Palm Beach, FL MSA Situation and Outlook Report  ... View developed using CV XE GIS. 5. Dallas UA - goto top Dallas-Fort Worth-Arlington, TX MSA Situation and Outlook Report 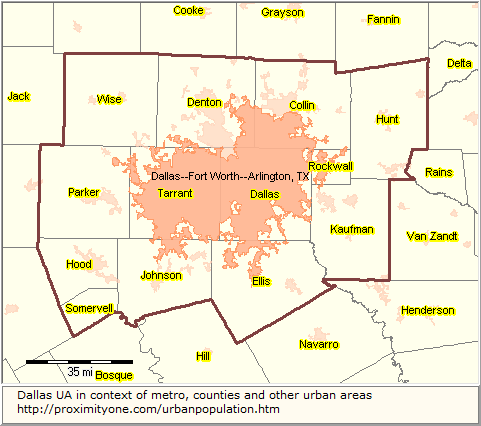 ... View developed using CV XE GIS. 6. Houston UA - goto top Houston-The Woodlands-Sugar Land, TX MSA Situation and Outlook Report 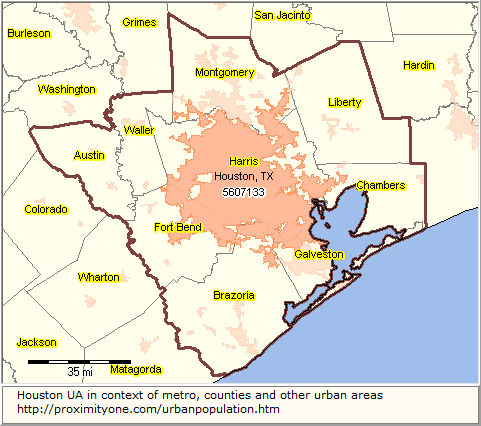 ... View developed using CV XE GIS. 7. Philadelphia UA - goto top Philadelphia-Camden-Wilmington, PA-NJ-DE-MD MSA Situation and Outlook Report 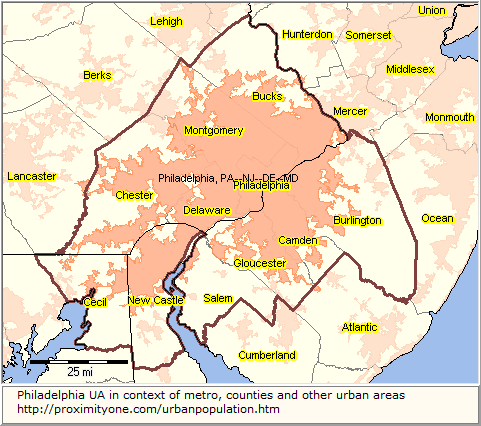 ... View developed using CV XE GIS. 8. Washington, DC UA - goto top Washington-Arlington-Alexandria, DC-VA-MD-WV MSA Situation and Outlook Report  ... View developed using CV XE GIS. 9. Atlanta UA - goto top Atlanta-Sandy Springs-Roswell, GA MSA Situation and Outlook Report  ... View developed using CV XE GIS. 10. Boston UA - goto top Boston-Cambridge-Newton, MA-NH MSA Situation and Outlook Report 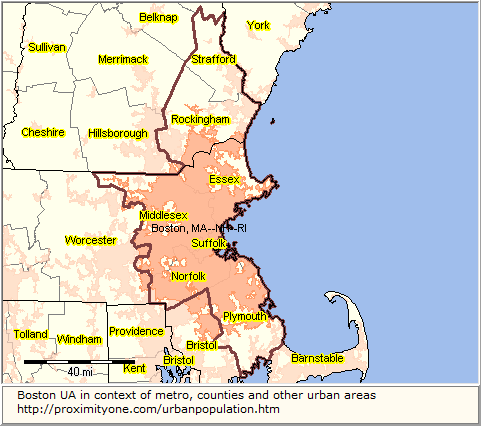 ... View developed using CV XE GIS. Related Sections • Access Urban Area Data Using Simple API Calls (ACS 2016 - 10/17) • Urban Area Demographic Trends 2010-15 (January 2017) • Urban/Rural Characteristics by ZIP Code • Urban/Rural Patterns by Congressional District • Urbanized Area Richer Demographics • Urban Agglomerations • School District Urban, Suburban, Rural Classification & Patterns • K-12 Public Schools by Urban/Rural Status About Urban Areas Based on 2010 definitions, an urban area comprises a densely settled core of census tracts and/or census blocks that meet minimum population density requirements, along with adjacent territory containing non-residential urban land uses as well as territory with low population density included to link outlying densely settled territory with the densely settled core. To qualify as an urban area, the territory identified according to criteria must encompass at least 2,500 people, at least 1,500 of which reside outside institutional group quarters. There are two types of urban areas: • Urbanized Areas (UAs) of 50,000 or more people; • Urban Clusters (UCs) of at least 2,500 and less than 50,000 people. • Rural encompasses all population, housing, and territory not included within an urban area. Support Using these Resources Learn more about accessing and using demographic-economic data and related analytical tools. Join us in a Data Analytics Lab session. There is no fee for these one-hour Web sessions. Each informal session is focused on a specific topic. The open structure also provides for Q&A and discussion of application issues of interest to participants. ProximityOne User Group Join the ProximityOne User Group to keep up-to-date with new developments relating to geographic-demographic-economic decision-making information resources. Receive updates and access to tools and resources available only to members. Use this form to join the User Group. Additional Information ProximityOne develops geographic-demographic-economic data and analytical tools and helps organizations knit together and use diverse data in a decision-making and analytical framework. We develop custom demographic/economic estimates and projections, develop geographic and geocoded address files, and assist with impact and geospatial analyses. Wide-ranging organizations use our tools (software, data, methodologies) to analyze their own data integrated with other data. Follow ProximityOne on Twitter at www.twitter.com/proximityone. Contact ProximityOne (888-364-7656) with questions about data covered in this section or to discuss custom estimates, projections or analyses for your areas of interest. |
|
|