
|
|
|
-- Demographic Economic Characteristics & Patterns The Americas Communities Program (ACP) provides organized, multi-sourced data and tools to facilitate planning and community development by individual communities (more information). This document is focused on Los Angeles, California and provides access to these resources to analyze and better understand characteristics of the community and regional environment. The most detailed attributes about Los Angeles shown in this document are the monthly updating Integrated Data Profile (#5) and the school district Comparative Analysis Profile (#6). Use the neighborhood patterns GIS (about GIS) resources (#7) to zoom-in to intersection level, add your own data, view other types of patterns. 1. Los Angeles in Context of Area
The following view shows Los Angeles in relation to the area and other geography.
 Click graphic for larger view. Counties shown with bold gray boundary (white solid label). Cities appear with green fill pattern (white label). The primary school district is shown with bold blue boundary (yellow label); other school districts have lighter blue boundary. Schools appear as red markers. 2. Los Angeles Metropolitan Area
Los Angeles is a principal city of the Los Angeles Metropolitan Statistical Area.
View Los Angeles metro structure/county components More about metropolitan areas 3. City Patterns -- Los Angeles, CA demographic-economic characteristics; compare with other cities
Main cities/places page
Interactive city/place demographic-economic tables; include all cities/places General Demographics | Social Characteristics | Economic Characteristics | Housing Characteristics 4. County-Metro Patterns -- Los Angeles County, CA; Los Angeles CA MSA demographic-economic characteristics; compare with areas
Main counties page
Interactive counties/metros demographic-economic tables; includes all counties/cities General Demographics | Social Characteristics | Economic Characteristics | Housing Characteristics 4.a. County/Regional Personal Income Trends Per Capita Income Trends 4.b. Demographic-Economic Projections View the interactive table showing U.S. by county projections to 2060. See how Los Angeles County population is projected to change and compare to adjacent and other counties of interest. 5. Los Angeles County Integrated Data Profile -- updates monthly
Los Angeles County, CA Integrated Data Profile
- Longitudinal trends/patterns; decennial census; American Community Survey - Monthly and quarterly workforce trends -- See related CV APIGateway IDP 6. Los Angeles School District Comparative Analysis -- Los Angeles, CA - California - U.S.; see related school district comparative profiles
Main school districts page
Interactive school districts demographic-economic tables - includes all school districts General Demographics | Social Characteristics | Economic Characteristics | Housing Characteristics 6.a. Los Angeles School Characteristics View/examine individual school characteristics: set1 ... set2 ... set3 ... set4 ... set5 ... set6 (XLS). See related schools interactive table and details. 7. Los Angeles Neighborhood Patterns
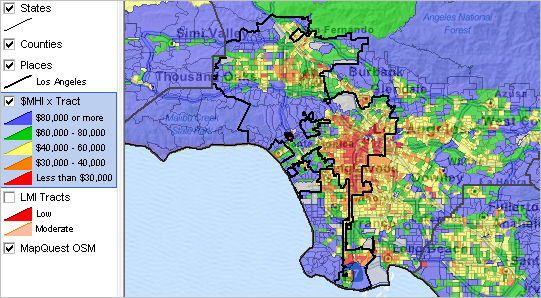
The following graphic shows patterns of economic prosperity for the Los Angeles area based on median household income (MHI) by census tract.
Colors associated with MHI intervals are shown in legend at left of map.
Los Angeles city shown with bold brown boundary. Use GIS resources to view other attributes/patterns.
See more about using the California by neighborhood GIS resources.
 7.a. Census Tract Patterns The above view shows attributes for census tracts in this community area. Learn more about these census tracts. Click on links to interactive tables listed below. Find tracts based on ZIP codes. Interactive census tracts demographic-economic tables; include all tracts General Demographics | Social Characteristics | Economic Characteristics | Housing Characteristics Census Tract Drill-down: Affordable Housing; Low & Moderate Income (LMI) Areas Zoom-in view using neighborhoods GIS project; this view uses the LMI Tracts layer; see map legend 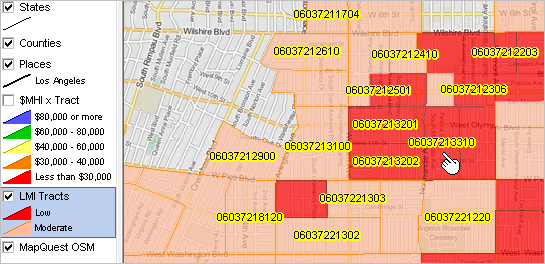 Side-by-side demographic-economic comparison of tracts 06037213201, 06037213202, 06037213310 in above view (XLS): General Demographics | Social Characteristics | Economic Characteristics | Housing Characteristics 7.b. Block Group Patterns Examining census tract subdivisions to block group level. Using BG data. 7.c. Census Block Characteristics Examining census block characteristics. Use APIGateway to extract Census 2010 Summary File 1 with the SF1 extract operation. 7.b. Augmenting Geographic Layers & Geospatial Analysis Add other types of geography to the GIS project using Digital Map Database (DMD) shapefiles (point, line and area features). Associate virtually any type of subject matter data to the geographic infrastructure down to the address and intersection level. See details. 8. ZIP Code Patterns -- Los Angeles area ZIP Code areas
Main ZIP Code section
Interactive counties/metros demographic-economic tables; includes all counties/cities General Demographics | Social Characteristics | Economic Characteristics | Housing Characteristics 9. Congressional Districts
Los Angeles area -- patterns of economic prosperity by neighborhood & congressional district
Main 113th Congressional Districts section Interactive 113th Congressional Districts demographic-economic tables; includes all congressional districts General Demographics | Social Characteristics | Economic Characteristics | Housing Characteristics 10. State Legislative Districts 11. Public Use Microdata Areas
Los Angeles/Los Angeles County is located in Public Use Microdata Areas (PUMA)
0603701 through 0603769 (69 PUMAs).
Develop custom demographic estimates (e.g., educational attainment by custom defined categories) using the
ACS Public Use Microdata Samples for
PUMAs (areas of 100,000 or more population). View map of California PUMAs.
Use the interactive table to view the geographic composition of this PUMA.
Interactive PUMA demographic-economic tables; includes all PUMAs General Demographics | Social Characteristics | Economic Characteristics | Housing Characteristics ProximityOne User Group The GIS resources reviewed in this section are provided as a part of the ProximityOne User Group. Members may download and use these resources on their own computers. Join now ... there is no fee to participate. Terms of Use
Resources made available via this Web page
are proprietary to ProximityOne.
The resources may be used in any manner without further authorization
except that none of the software nor data files may be redistributed.
Links to this page are encouraged as well as use of the data in planning documents, analytical reports, stories and analyses.
Any use of these resources is solely at the discretion of the user.
There is no warranty or guarantee of any type.
Additional Information
California Communities is one of several state by community programs.
Community Profiles, developed as a part of the state by community programs, are updated frequently. Join the California Communities program to receive news on updates and new developments.
Join us in weekly decision-making information (DMI) sessions where we cover selected topics
as well as Q&A relating to Community Profiles (more information).
ProximityOne develops geographic-demographic-economic data and analytical tools and helps organizations knit together and use diverse data in a decision-making and analytical framework. We develop custom demographic/economic estimates and projections, develop geographic and geocoded address files, and assist with impact and geospatial analyses. Wide-ranging organizations use our tools (software, data, methodologies) to analyze their own data integrated with other data. Follow ProximityOne on Twitter at www.twitter.com/proximityone. Contact ProximityOne (888-364-7656) with questions about data covered in this section or to discuss custom estimates, projections or analyses for your areas of interest. |
|
|