
|
|
|
Decision-Making Information Web Sessions -- DMI#04 -- Census Block, Block Group & Census Tract Geographic-Demographic Pattern Analysis
About this Session This session reviews concepts, structure, availability, access and use of census block, block group & census tract geographic-demographic-economic data. Topics covered in this session are intended for data specialists, researchers, analysts and others who need data resources and tools. A "One-to-One" version of this session is available to meet the needs of a specific audience and optionally focused on specific geography, subject matter and application framework. Contact us (mention 1-to-1 dmis04 Web session in text section) or call (888.364.7656) for more information. We have structured this document/session as a combined reference and referral for your post-web session use. We conduct this session every few weeks with periodic updates and changing application focuses. An expanded version of this page is available to members of the ProximityOne User Group. This session makes use of the ProximityOne CV XE GIS and related software. Topics covered in this session do not require use of this software. By using these software tools, we are able to support existing user interests and provide common, integrated, software tools for all participants. Any version of the software can be used. Participants who have any version of the software can emulate steps/topics reviewed in this session and expand on topics covered to meet special interests. Optionally use this CV XE GIS installer to install CV XE GIS (no fee) on your Windows-based computer. ProximityOne User Group. members may install any of the Level 1 software tools. • Presenter: Warren Glimpse (about) • This page (being viewed): http://proximityone.com/dmis04_smallarea.htm • Register (no fee) • 2015 Sessions: ... see list of upcoming sessions ... these sessions cover both basic and a set of new topics Updates • Calendar; General Navigation • http://proximityone.com/index.htm (now shows Webinars in top center) • http://proximityone.com/whatsnew.htm (shows new state income page & NY K12 GIS section .. both below) • http://proximityone.com/cv.htm CV XE GIS software • http://proximityone.com/metrodynamics.htm MetroDynamics/MetroProfiles • 2012-13 Public Schools Interactive Table • 2012-13 Local Education Agencies Interactive Table • http://proximityone.com/statetrends.htm (new state income page -- below) • http://proximityone.com/dataresources/guide/index.html?k12_ny_gis_project.htm -- NY 2015 K12 GIS project -- Guide to Data Resources • http://proximityone.com/state_mhi2013.htm -- state income and income inequality measures -- state income and income inequality measures -- blog Census Block, Block Group & Census Tract Geographic-Demographic Pattern Analysis Overview & Reference Pages Census Block ... Block Group ... Census Tract ... Glossary 1. Geography: Census 2000, Census 2010, American Community Survey 1.1. Census Block-Block Group-Tract Relationships The following graphic shows the relationship between census blocks, block groups and census tracts  Click graphic for larger view. 1.2. Census Blocks Census Bureau census blocks are the smallest geographic areas for which U.S. national scope, wall-to-wall, detailed demographic data are tabulated. The Census Bureau only tabulates data from the decennial census at the census block level. Census block level data are required for many purposes, a fundamental one being redistricting. Census blocks (more than 11 million for Census 2010) are potentially redefined for each decennial census (both in terms of geographic area/boundary and code. Census blocks average 100 population though many are quite larger. GEOID/geocode; unique identifier: SSCCCTTTTTTBBBB where SS:state FIPS code; CCC: county FIPS code; TTTTTT:census tract code; BBBB: census block More about Census Blocks and Block Codes 1.3. Block Groups Census block groups are sets of one or more contiguous census blocks. Block groups (approximately 217,000 for Census 2010) are the smallest geographic areas for which "richer demographics" (from American Community Survey (ACS) 5-year estimates) such as educational attainment, income, employment etc. are tabulated/estimated. Block groups average 1,400 population though many are quite larger. GEOID/geocode; unique identifier: SSCCCTTTTTTG where SS:state FIPS code; CCC: county FIPS code; TTTTTT: tract code; G: block group (first digit of block code) More about Census Block Groups and Block Group Codes 1.4. Census Tracts Census tracts are sets of one or more contiguous block groups. Counties are comprised of one of more census tracts; census tracts always nest within counties. Census tracts (approximately 73,000 for Census 2010) are the smallest geographic areas for **all** "richer demographics" (from American Community Survey (ACS) 5-year estimates) such as educational attainment, income, employment etc. are tabulated/estimated. Census tracts average 4,000 population though many are quite larger. Estimates for census tracts are generally more reliable that estimates for block groups. GEOID/geocode; unique identifier: SSCCCTTTTTT where SS:state FIPS code; CCC: county FIPS code; TTTTTT:census tract code More about Census Tracts and Tract Codes View below shows San Diego area by Census 2010 census tract with mini-profile for selected tract (see pointer).  1.5. TIGER/Line Boundary Files; Related Geography The Census Bureau TIGER/Line shapefiles are the geographic backbone for all Census Bureau demographic-economic data. The TIGER/Line shapefiles are essential to develop statistical and political area reference and thematic pattern maps. Even if you are analyzing non-Census-sourced data, these shapefiles provide the geographic framework for Geographic Information System (about GIS) applications. Boundary files, as TIGER/Line shapefiles, are available for different vintages of blocks, block groups and tracts. Extracting TIGER/Line Shapefile Geometry; Use with Google Maps API • Fort Bend County, TX by census tract & Sugar Land • Warren County, IA by census tract & Indianola • Warren County, MO by census tract & Warrenton • Washington, DC by census tract • Washington, DC by ZIP Code • Kansas City, MO-KS Area by ZIP Code • Houston, TX area school districts TIGER 2014 released August 2014. See related Web session on Using TIGER/Line. 1.6. Census 2010 Geographic Tallies 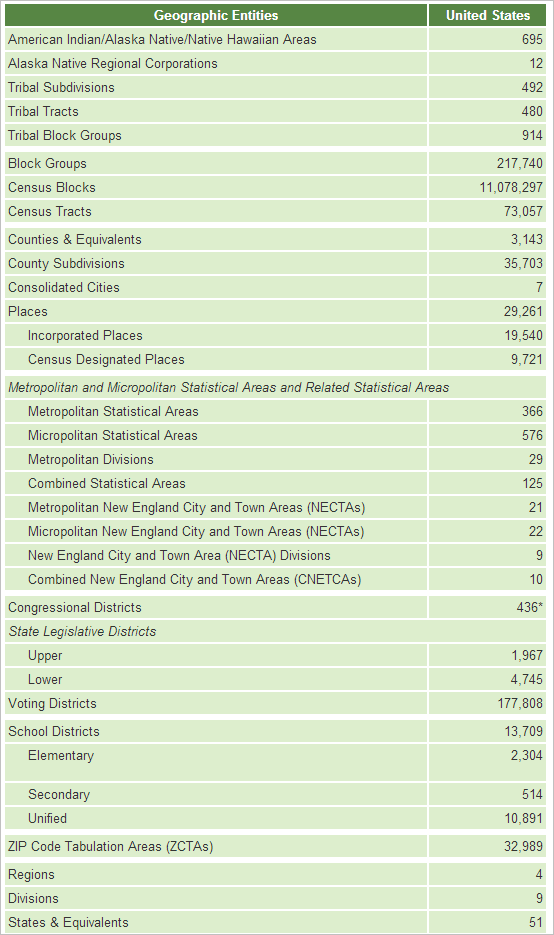
1.7. Relationship & Equivalencing Files • Census 2010 Demographics for Census 2000 Geography -- http://proximityone.com/tracts0010.htm • Census Tracts & ZIP Code Areas -- http://proximityone.com/ziptractequiv.htm 2. Scope of Subject Matter: Data Availability by Block, Block Group, Census Tract • Table/item terminology, structure, field names - ACS example: Table B19037 Age of Householder by Household Income - Census 2010 SF1 example: Table P003 Population by Race • Census 2000 -- complete count (SF1) (block, BG, tract) and estimates (SF3) (BG and tract, no block • Census 2010 -- complete count only; Summary File 1 (block, BG, tract) • ACS 2010 5 year estimates -- overview (BG, tract) • ACS 2011 5 year estimates -- overview (BG, tract) • ACS 2012 5 year estimates -- overview (BG, tract) • ACS 2013 5 year (December 2014) (BG, tract) • ACS BG data only available via summary file; scope of subject matter differs Tract PCT/HCT tables (not available block or BG) 2.1. Determining ACS Block Group Subject Matter Availability • Use interactive table to determine scope of available BG subject matter • See Appendix E of ACS technical documentation to determine exact table/item availability • Use related Table shells (does not reflect BG availability) - example: Table B19037 Age of Householder by Household Income; 69 items available census tract up iterated by race/origin (B19037A ...) but no race/origin iteration at BG level -- B19037A ... tables are not available. 3. Mapping Block, Block Group, Census Tract GeoDemographics • Using CV XE GIS; general operations; User Group no fee availability • San Diego GIS Application - Using TIGER/Line shapefiles; accsss & integration into GIS projects - Making thematic maps using small area data • Mapping School Attendance Zones (Blocks) - http://proximityone.com/sch1213ua_frisco.htm • Mapping K-12 Schools by Urban/Rural Status (Blocks) - http://proximityone.com/sch1213ua.htm • Mapping Neighborhood Patterns (Tracts) - Benefits; general operations; User Group no fee availability - http://proximityone.com/neighborhood_patterns.htm 4. Using the Site Analysis tool • Benefits; general operations; User Group no fee availability • BG demographics via API • Visually accessing BG subject matter dynamically • Aggregating BG data into study area summaries • Site Analysis Applications Using Block Groups - http://proximityone.com/cvsitesbg.htmm 5. Using the Demographic Economic Data Extraction DEDE API Tool • Benefits; general operations; User Group no fee availability • San Diego GIS Application 6. Integrating Demograpic-Economic Subject Matter Data into Shapefiles Using dBMerge • Benefits; general operations; User Group no fee availability • San Diego GIS Application using ACS block group data extracted using DEDE (see above) 7. Assigning Geocodes/Subject Matter Values to Addresses: Using Code Addresses Tool • General operations; User Group no fee availability • Assigning census block code to address via API operation • Assigning block group subject matter item (user selected) to address via API operation 8. Using Web-based interactive tables to view, query, rank, compare small area data Census Tracts • ACS 2012 -- General Demographics - http://proximityone.com/tracts12dp1.htm • ACS 2012 -- Social Characteristics - http://proximityone.com/tracts12dp2.htm • ACS 2012 -- Economic Characteristics - http://proximityone.com/tracts12dp3.htm • ACS 2012 -- Housing Characteristics - http://proximityone.com/tracts12dp4.htm Block Groups - http://proximityone.com/blockgroups.htm Other interactive tables - http://proximityone.com/rankingtables.htm 9. Census Tract Current Estimates & Projections • ProximityOne sourced • Latest Census estimates centric to 2010 (ACS 2012) • Annual and annually updated; 2010-2019 ("5 year projections") • Population by single year of age by gender by race/origin; housing units; households; vacant units Additional Information ProximityOne develops geodemographic-economic data and analytical tools and helps organizations knit together and use diverse data in a decision-making and analytical framework. We develop custom demographic/economic estimates and projections, develop geographic and geocoded address files, and assist with impact and geospatial analyses. Wide-ranging organizations use our tools (software, data, methodologies) to analyze their own data integrated with other data. Follow ProximityOne on Twitter at www.twitter.com/proximityone. Contact us (888-364-7656) with questions about data covered in this section or to discuss custom estimates, projections or analyses for your areas of interest. | |||||
|
| |||||