
|
|
|
Mississippi Demographic-Economic Characteristics & Trends
New & Updates: 09/28/18. County detailed demographic characteristics & trends profiles ... use links in Section 7. Counties to view individual counties 09/14/18. New 2018 Vintage Metropolitan Area delineations announced by OMB ... see Mississippi metros & counties in Section 5. Metros below 04/05/18. Most sections updated. 03/25/18. New: How and Why Mississippi Demographics are Changing 1. Visual pattern analysis using GIS resources ... examine Mississippi neighborhood/market area demographic-economic patterns. Develop collaborative insights; zoom-in to areas of interest; create alternative views; add your own data. 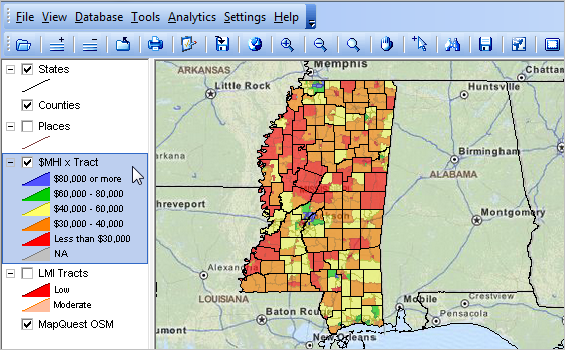 .. View developed with CV XE GIS software. .. install Mississippi by neighborhood GIS project; create custom maps. 2. Digital Map Database -- point, line and area features (shapefiles) covering the U.S. 3. Situation & Outlook .. multi-dimensional demographic-economic characteristics and trends. .. projections to 2060 .. single year of age x gender x race/origin 4. Mississippi Demographic-Economic Characteristics & Patterns Mississippi Population & Components of Change The population of Mississippi changed from 2,970,437 in 2010 to 2,984,100 in 2017, a change of 13,663 (0.46%). The change reflects 270,298 births and 212,555 deaths (57,743 natural increase) with -58,626 domestic migration and 14,036 international migration (-44,590 net migration). Mississippi State Economy • Economic Profile • Personal Income by Major Source • Earnings by Source & Sector • Employment by Sector • Transfer Payments • Farm Income & Expenditures • Interactive Table -- all states & counties 5. Metropolitan Areas ... goto top -- 2018 Vintage Metropolitan Areas (9/14/18) announced by OMB -- interactive demographic-economic data table -- create custom metro maps -- create Mississippi all CBSAs ACS 2016 1 year estimates dataset .. about this feature -- click link in scroll section below to view Situation & Outlook Metro Report.
Brookhaven, MS MISA (15020) Clarksdale, MS MISA (17260) Cleveland, MS MISA (17380) Columbus, MS MISA (18060) Corinth, MS MISA (18420) Greenville, MS MISA (24740) Greenwood, MS MISA (24900) Grenada, MS MISA (24980) Gulfport-Biloxi-Pascagoula, MS MSA (25060) Hattiesburg, MS MSA (25620) Indianola, MS MISA (26940) Jackson, MS MSA (27140) Laurel, MS MISA (29860) McComb, MS MISA (32620) Meridian, MS MISA (32940) Natchez, MS-LA MISA (35020) Oxford, MS MISA (37060) Picayune, MS MISA (38100) Starkville, MS MISA (44260) Tupelo, MS MISA (46180) Vicksburg, MS MISA (46980) 6. 115th Congressional Districts -- interactive demographic-economic data tables -- create custom Congressional District maps -- create Mississippi all congressional districts ACS 2016 1 year estimates dataset -- -- about this feature 7. Counties ... goto top -- interactive demographic-economic data tables -- official population estimates interactive table 2010-2017 -- create Mississippi all counties ACS 2016 5 year estimates dataset -- -- about this feature -- click link following county name in scroll section below to view demographic profile.
Adams County (28001) Alcorn County (28003) Amite County (28005) Attala County (28007) Benton County (28009) Bolivar County (28011) Calhoun County (28013) Carroll County (28015) Chickasaw County (28017) Choctaw County (28019) Claiborne County (28021) Clarke County (28023) Clay County (28025) Coahoma County (28027) Copiah County (28029) Covington County (28031) DeSoto County (28033) Forrest County (28035) Franklin County (28037) George County (28039) Greene County (28041) Grenada County (28043) Hancock County (28045) Harrison County (28047) Hinds County (28049) Holmes County (28051) Humphreys County (28053) Issaquena County (28055) Itawamba County (28057) Jackson County (28059) Jasper County (28061) Jefferson County (28063) Jefferson Davis County (28065) Jones County (28067) Kemper County (28069) Lafayette County (28071) Lamar County (28073) Lauderdale County (28075) Lawrence County (28077) Leake County (28079) Lee County (28081) Leflore County (28083) Lincoln County (28085) Lowndes County (28087) Madison County (28089) Marion County (28091) Marshall County (28093) Monroe County (28095) Montgomery County (28097) Neshoba County (28099) Newton County (28101) Noxubee County (28103) Oktibbeha County (28105) Panola County (28107) Pearl River County (28109) Perry County (28111) Pike County (28113) Pontotoc County (28115) Prentiss County (28117) Quitman County (28119) Rankin County (28121) Scott County (28123) Sharkey County (28125) Simpson County (28127) Smith County (28129) Stone County (28131) Sunflower County (28133) Tallahatchie County (28135) Tate County (28137) Tippah County (28139) Tishomingo County (28141) Tunica County (28143) Union County (28145) Walthall County (28147) Warren County (28149) Washington County (28151) Wayne County (28153) Webster County (28155) Wilkinson County (28157) Winston County (28159) Yalobusha County (28161) Yazoo County (28163) 8. Cities/Places -- interactive demographic-economic data tables -- create custom city/place maps. -- create Mississippi all places ACS 2016 5 year estimates dataset -- -- about this feature. -- click link following city/place name in scroll section below to view demographic-economic profile
Aberdeen (city) (2800180) Amory (city) (2801260) Batesville (city) (2803620) Bay St. Louis (city) (2803980) Biloxi (city) (2806220) Booneville (city) (2807780) Brandon (city) (2808300) Brookhaven (city) (2808820) Byram (city) (2810140) Canton (city) (2811100) Carthage (city) (2811780) Clarksdale (city) (2813820) Cleveland (city) (2814260) Clinton (city) (2814420) Columbia (city) (2815340) Columbus (city) (2815380) Corinth (city) (2815700) D'Iberville (city) (2819180) Diamondhead (CDP) (2819100) Flowood (city) (2825100) Forest (city) (2825340) Gautier (city) (2826860) Greenville (city) (2829180) Greenwood (city) (2829340) Grenada (city) (2829460) Gulf Hills (CDP) (2829620) Gulf Park Estates (CDP) (2829660) Gulfport (city) (2829700) Hattiesburg (city) (2831020) Hernando (city) (2831780) Holly Springs (city) (2833100) Horn Lake (city) (2833700) Indianola (city) (2834740) Jackson (city) (2836000) Kosciusko (city) (2838320) Latimer (CDP) (2839520) Laurel (city) (2839640) Long Beach (city) (2841680) Louisville (city) (2842280) Madison (city) (2844520) McComb (city) (2843280) Meridian (city) (2846640) Moss Point (city) (2849240) Natchez (city) (2850440) New Albany (city) (2851000) Ocean Springs (city) (2853520) Olive Branch (city) (2854040) Oxford (city) (2854840) Pascagoula (city) (2855360) Pearl (city) (2855760) Petal (city) (2856800) Philadelphia (city) (2856960) Picayune (city) (2857160) Pontotoc (city) (2859160) Richland (city) (2862400) Ridgeland (city) (2862520) Ripley (city) (2862600) Senatobia (city) (2866440) Southaven (city) (2869280) St. Martin (CDP) (2864680) Starkville (city) (2870240) Tupelo (city) (2874840) Vancleave (CDP) (2876200) Vicksburg (city) (2876720) Waveland (city) (2878200) Waynesboro (city) (2878360) West Hattiesburg (CDP) (2878890) West Point (city) (2879120) Yazoo City (city) (2881520) 9. Census Tracts -- interactive demographic-economic data tables -- annual demographic-economic estimates & projections; 2010-2021 -- census tract data analytics -- create Mississippi all tracts ACS 2016 5 year estimates dataset -- -- about this feature 10. ZIP Code Areas -- interactive demographic-economic data tables -- create all U.S. ZIP Code areas ACS 2016 5 year estimates dataset -- -- about this feature 11. K-12 Education, Schools & School Districts -- school district interactive demographic-economic data tables -- children's demographics by school district school district profiles -- K-12 Public Schools interactive public schools table -- K-12 Private Schools interactive private schools table -- create Mississippi all unified school districts ACS 2016 5 year estimates dataset -- -- about this feature 12. Block Groups -- accessing & integrating block group data using API tools 13. Census Blocks -- accessing & integrating census block data using API tools Using these Resources Knowing "where we are" and "how things have changed" are key factors in knowing about the where, when and how of future change -- and how that change might impact you. There are many sources of this knowledge. Often the required data do not knit together in an ideal manner. Key data are available for different types of geography, become available at different points in time and are often not the perfect subject matter. This section is intended to provide access to relevant data and a means to consume the data more effectively than might otherwise be possible. Use data, tools and resources provided/described here in combination with other data to perform wide-ranging data analytics. See examples. Terms of Use Data accessible in this section may be used in reports, analyses and stories. These data may not be redistributed in bulk or as files. There is no warranty of any type associated with any aspect of this section or associated data. The user of this section and associated data is solely responsible for any use, direct or indirect, that might be made of the content. Support Using these Resources Learn more about demographic economic data and related analytical tools. Join us in a Data Analytics Lab session. There is no fee for these one-hour informal Web sessions. The open structure provides for Q&A and discussion of application issues of interest to participants. ProximityOne User Group Join the ProximityOne User Group to keep up-to-date with new developments relating to children's demographics and school district decision-making information resources. Receive updates and access to tools and resources available only to members. Use this form to join the User Group. Additional Information ProximityOne develops geographic-demographic-economic data and analytical tools and helps organizations knit together and use diverse data in a decision-making and analytical framework. We develop custom demographic/economic estimates and projections, develop geographic and geocoded address files, and assist with impact and geospatial analyses. Wide-ranging organizations use our tools (software, data, methodologies) to analyze their own data integrated with other data. Follow ProximityOne on Twitter at www.twitter.com/proximityone. Contact ProximityOne (888-364-7656) with questions about data covered in this section or to discuss custom estimates, projections or analyses for your areas of interest. |
|
|