
|
|
|
South Dakota Demographic-Economic Characteristics & Trends
New & Updates: 09/28/18. County detailed demographic characteristics & trends profiles ... use links in Section 7. Counties to view individual counties 09/14/18. New 2018 Vintage Metropolitan Area delineations announced by OMB ... see South Dakota metros & counties in Section 5. Metros below 04/05/18. Most sections updated. 03/25/18. New: How and Why South Dakota Demographics are Changing 1. Visual pattern analysis using GIS resources ... examine South Dakota neighborhood/market area demographic-economic patterns. Develop collaborative insights; zoom-in to areas of interest; create alternative views; add your own data. 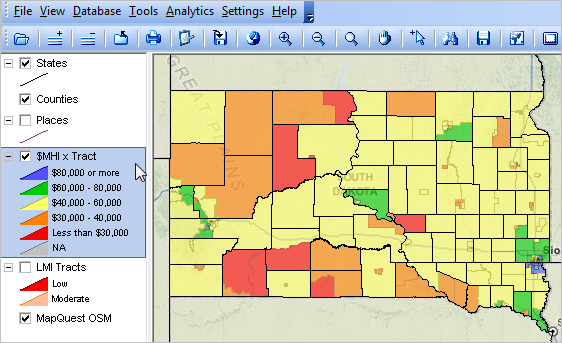 .. View developed with CV XE GIS software. .. install South Dakota by neighborhood GIS project; create custom maps. 2. Digital Map Database -- point, line and area features (shapefiles) covering the U.S. 3. Situation & Outlook .. multi-dimensional demographic-economic characteristics and trends. .. projections to 2060 .. single year of age x gender x race/origin 4. South Dakota Demographic-Economic Characteristics & Patterns South Dakota Population & Components of Change The population of South Dakota changed from 816,227 in 2010 to 869,666 in 2017, a change of 53,439 (6.55%). The change reflects 84,840 births and 51,539 deaths (33,301 natural increase) with 11,214 domestic migration and 8,735 international migration (19,949 net migration). South Dakota State Economy • Economic Profile • Personal Income by Major Source • Earnings by Source & Sector • Employment by Sector • Transfer Payments • Farm Income & Expenditures • Interactive Table -- all states & counties 5. Metropolitan Areas ... goto top -- 2018 Vintage Metropolitan Areas (9/14/18) announced by OMB -- interactive demographic-economic data table -- create custom metro maps -- create South Dakota all CBSAs ACS 2016 1 year estimates dataset .. about this feature -- click link in scroll section below to view Situation & Outlook Metro Report.
Aberdeen, SD MISA (10100) Brookings, SD MISA (15100) Huron, SD MISA (26700) Mitchell, SD MISA (33580) Pierre, SD MISA (38180) Rapid City, SD MSA (39660) Sioux Falls, SD MSA (43620) Spearfish, SD MISA (43940) Vermillion, SD MISA (46820) Watertown, SD MISA (47980) Yankton, SD MISA (49460) 6. 115th Congressional Districts -- interactive demographic-economic data tables -- create custom Congressional District maps -- create South Dakota all congressional districts ACS 2016 1 year estimates dataset -- -- about this feature 7. Counties ... goto top -- interactive demographic-economic data tables -- official population estimates interactive table 2010-2017 -- create South Dakota all counties ACS 2016 5 year estimates dataset -- -- about this feature -- click link following county name in scroll section below to view demographic profile.
Aurora County (46003) Beadle County (46005) Bennett County (46007) Bon Homme County (46009) Brookings County (46011) Brown County (46013) Brule County (46015) Buffalo County (46017) Butte County (46019) Campbell County (46021) Charles Mix County (46023) Clark County (46025) Clay County (46027) Codington County (46029) Corson County (46031) Custer County (46033) Davison County (46035) Day County (46037) Deuel County (46039) Dewey County (46041) Douglas County (46043) Edmunds County (46045) Fall River County (46047) Faulk County (46049) Grant County (46051) Gregory County (46053) Haakon County (46055) Hamlin County (46057) Hand County (46059) Hanson County (46061) Harding County (46063) Hughes County (46065) Hutchinson County (46067) Hyde County (46069) Jackson County (46071) Jerauld County (46073) Jones County (46075) Kingsbury County (46077) Lake County (46079) Lawrence County (46081) Lincoln County (46083) Lyman County (46085) McCook County (46087) McPherson County (46089) Marshall County (46091) Meade County (46093) Mellette County (46095) Miner County (46097) Minnehaha County (46099) Moody County (46101) Oglala Lakota County (46102) Pennington County (46103) Perkins County (46105) Potter County (46107) Roberts County (46109) Sanborn County (46111) Spink County (46115) Stanley County (46117) Sully County (46119) Todd County (46121) Tripp County (46123) Turner County (46125) Union County (46127) Walworth County (46129) Yankton County (46135) Ziebach County (46137) 8. Cities/Places -- interactive demographic-economic data tables -- create custom city/place maps. -- create South Dakota all places ACS 2016 5 year estimates dataset -- -- about this feature. -- click link following city/place name in scroll section below to view demographic-economic profile
Aberdeen (city) (4600100) Belle Fourche (city) (4604380) Box Elder (city) (4606620) Brandon (city) (4606840) Brookings (city) (4607580) Huron (city) (4631060) Madison (city) (4640220) Mitchell (city) (4643100) Pierre (city) (4649600) Rapid City (city) (4652980) Rapid Valley (CDP) (4653007) Sioux Falls (city) (4659020) Spearfish (city) (4660020) Sturgis (city) (4662100) Vermillion (city) (4666700) Watertown (city) (4669300) Yankton (city) (4673060) 9. Census Tracts -- interactive demographic-economic data tables -- annual demographic-economic estimates & projections; 2010-2021 -- census tract data analytics -- create South Dakota all tracts ACS 2016 5 year estimates dataset -- -- about this feature 10. ZIP Code Areas -- interactive demographic-economic data tables -- create all U.S. ZIP Code areas ACS 2016 5 year estimates dataset -- -- about this feature 11. K-12 Education, Schools & School Districts -- school district interactive demographic-economic data tables -- children's demographics by school district school district profiles -- K-12 Public Schools interactive public schools table -- K-12 Private Schools interactive private schools table -- create South Dakota all unified school districts ACS 2016 5 year estimates dataset -- -- about this feature 12. Block Groups -- accessing & integrating block group data using API tools 13. Census Blocks -- accessing & integrating census block data using API tools Using these Resources Knowing "where we are" and "how things have changed" are key factors in knowing about the where, when and how of future change -- and how that change might impact you. There are many sources of this knowledge. Often the required data do not knit together in an ideal manner. Key data are available for different types of geography, become available at different points in time and are often not the perfect subject matter. This section is intended to provide access to relevant data and a means to consume the data more effectively than might otherwise be possible. Use data, tools and resources provided/described here in combination with other data to perform wide-ranging data analytics. See examples. Terms of Use Data accessible in this section may be used in reports, analyses and stories. These data may not be redistributed in bulk or as files. There is no warranty of any type associated with any aspect of this section or associated data. The user of this section and associated data is solely responsible for any use, direct or indirect, that might be made of the content. Support Using these Resources Learn more about demographic economic data and related analytical tools. Join us in a Data Analytics Lab session. There is no fee for these one-hour informal Web sessions. The open structure provides for Q&A and discussion of application issues of interest to participants. ProximityOne User Group Join the ProximityOne User Group to keep up-to-date with new developments relating to children's demographics and school district decision-making information resources. Receive updates and access to tools and resources available only to members. Use this form to join the User Group. Additional Information ProximityOne develops geographic-demographic-economic data and analytical tools and helps organizations knit together and use diverse data in a decision-making and analytical framework. We develop custom demographic/economic estimates and projections, develop geographic and geocoded address files, and assist with impact and geospatial analyses. Wide-ranging organizations use our tools (software, data, methodologies) to analyze their own data integrated with other data. Follow ProximityOne on Twitter at www.twitter.com/proximityone. Contact ProximityOne (888-364-7656) with questions about data covered in this section or to discuss custom estimates, projections or analyses for your areas of interest. |
|
|