
|
|
|
Massachusetts Demographic-Economic Characteristics & Trends
New & Updates: 09/28/18. County detailed demographic characteristics & trends profiles ... use links in Section 7. Counties to view individual counties 09/14/18. New 2018 Vintage Metropolitan Area delineations announced by OMB ... see Massachusetts metros & counties in Section 5. Metros below 04/05/18. Most sections updated. 03/25/18. New: How and Why Massachusetts Demographics are Changing 1. Visual pattern analysis using GIS resources ... examine Massachusetts neighborhood/market area demographic-economic patterns. Develop collaborative insights; zoom-in to areas of interest; create alternative views; add your own data. 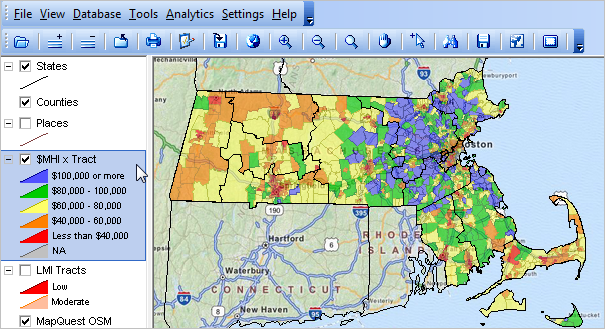 .. View developed with CV XE GIS software. .. install Massachusetts by neighborhood GIS project; create custom maps. 2. Digital Map Database -- point, line and area features (shapefiles) covering the U.S. 3. Situation & Outlook .. multi-dimensional demographic-economic characteristics and trends. .. projections to 2060 .. single year of age x gender x race/origin 4. Massachusetts Demographic-Economic Characteristics & Patterns Massachusetts Population & Components of Change The population of Massachusetts changed from 6,564,943 in 2010 to 6,859,819 in 2017, a change of 294,876 (4.49%). The change reflects 503,815 births and 387,456 deaths (116,359 natural increase) with -102,483 domestic migration and 284,765 international migration (182,282 net migration). Massachusetts State Economy • Economic Profile • Personal Income by Major Source • Earnings by Source & Sector • Employment by Sector • Transfer Payments • Farm Income & Expenditures • Interactive Table -- all states & counties 5. Metropolitan Areas ... goto top -- 2018 Vintage Metropolitan Areas (9/14/18) announced by OMB -- interactive demographic-economic data table -- create custom metro maps -- create Massachusetts all CBSAs ACS 2016 1 year estimates dataset .. about this feature -- click link in scroll section below to view Situation & Outlook Metro Report.
Barnstable Town, MA MSA (12700) Boston-Cambridge-Newton, MA-NH MSA (14460) Greenfield Town, MA MISA (24640) Pittsfield, MA MSA (38340) Springfield, MA MSA (44140) Vineyard Haven, MA MISA (47240) Worcester, MA-CT MSA (49340) 6. 115th Congressional Districts -- interactive demographic-economic data tables -- create custom Congressional District maps -- create Massachusetts all congressional districts ACS 2016 1 year estimates dataset -- -- about this feature 7. Counties ... goto top -- interactive demographic-economic data tables -- official population estimates interactive table 2010-2017 -- create Massachusetts all counties ACS 2016 5 year estimates dataset -- -- about this feature -- click link following county name in scroll section below to view demographic profile.
Barnstable County (25001) Berkshire County (25003) Bristol County (25005) Dukes County (25007) Essex County (25009) Franklin County (25011) Hampden County (25013) Hampshire County (25015) Middlesex County (25017) Nantucket County (25019) Norfolk County (25021) Plymouth County (25023) Suffolk County (25025) Worcester County (25027) 8. Cities/Places -- interactive demographic-economic data tables -- create custom city/place maps. -- create Massachusetts all places ACS 2016 5 year estimates dataset -- -- about this feature. -- click link following city/place name in scroll section below to view demographic-economic profile
Abington (CDP) (2500135) Adams (CDP) (2500590) Agawam Town (city) (2500840) Amesbury Town (city) (2501260) Amherst Center (CDP) (2501360) Andover (CDP) (2501430) Arlington (CDP) (2501640) Athol (CDP) (2502515) Attleboro (city) (2502690) Barnstable Town (city) (2503690) Belmont (CDP) (2505105) Beverly (city) (2505595) Bliss Corner (CDP) (2506170) Boston (city) (2507000) Braintree Town (city) (2507740) Bridgewater (CDP) (2508050) Brockton (city) (2509000) Brookline (CDP) (2509210) Burlington (CDP) (2509875) Cambridge (city) (2511000) Chelsea (city) (2513205) Chicopee (city) (2513660) Clinton (CDP) (2514430) Cochituate (CDP) (2514570) Danvers (CDP) (2516285) Dedham (CDP) (2516530) East Falmouth (CDP) (2518980) Easthampton Town (city) (2519370) Everett (city) (2521990) Fall River (city) (2523000) Fitchburg (city) (2523875) Foxborough (CDP) (2524855) Framingham (CDP) (2524960) Franklin Town (city) (2525172) Gardner (city) (2525485) Gloucester (city) (2526150) Greenfield Town (city) (2527100) Haverhill (city) (2529405) Hingham (CDP) (2530175) Holbrook (CDP) (2530420) Holyoke (city) (2530840) Hudson (CDP) (2531575) Hull (CDP) (2531680) Kingston (CDP) (2533185) Lawrence (city) (2534550) Leominster (city) (2535075) Lexington (CDP) (2535250) Longmeadow (CDP) (2536335) Lowell (city) (2537000) Lynn (city) (2537490) Lynnfield (CDP) (2537595) Malden (city) (2537875) Mansfield Center (CDP) (2538230) Marblehead (CDP) (2538435) Marlborough (city) (2538715) Maynard (CDP) (2539660) Medfield (CDP) (2539730) Medford (city) (2539835) Melrose (city) (2540115) Methuen Town (city) (2540710) Middleborough Center (CDP) (2540885) Milford (CDP) (2541200) Milton (CDP) (2541725) Nantucket (CDP) (2543755) Needham (CDP) (2544140) New Bedford (city) (2545000) Newburyport (city) (2545245) Newton (city) (2545560) North Adams (city) (2546225) North Amherst (CDP) (2546295) North Scituate (CDP) (2549165) Northampton (city) (2546330) Northborough (CDP) (2546785) Norwood (CDP) (2550285) Oxford (CDP) (2551790) Palmer Town (city) (2552144) Peabody (city) (2552490) Pinehurst (CDP) (2553680) Pittsfield (city) (2553960) Plymouth (CDP) (2554275) Quincy (city) (2555745) Randolph (CDP) (2555990) Reading (CDP) (2556165) Revere (city) (2556585) Salem (city) (2559105) Saugus (CDP) (2560050) Scituate (CDP) (2560295) Sharon (CDP) (2560820) Somerset (CDP) (2562465) Somerville (city) (2562535) South Yarmouth (CDP) (2566035) Southbridge Town (city) (2563345) Spencer (CDP) (2566070) Springfield (city) (2567000) Stoneham (CDP) (2567700) Swampscott (CDP) (2568680) Taunton (city) (2569170) Wakefield (CDP) (2572250) Walpole (CDP) (2572460) Waltham (city) (2572600) Ware (CDP) (2572845) Watertown Town (city) (2573440) Webster (CDP) (2573930) Wellesley (CDP) (2574210) West Concord (CDP) (2575680) West Springfield Town (city) (2577890) West Yarmouth (CDP) (2578795) Westfield (city) (2576030) Weymouth Town (city) (2578972) Whitinsville (CDP) (2579495) Wilmington (CDP) (2580195) Winchester (CDP) (2580545) Winthrop Town (city) (2581005) Woburn (city) (2581035) Worcester (city) (2582000) Yarmouth Port (CDP) (2582595) 9. Census Tracts -- interactive demographic-economic data tables -- annual demographic-economic estimates & projections; 2010-2021 -- census tract data analytics -- create Massachusetts all tracts ACS 2016 5 year estimates dataset -- -- about this feature 10. ZIP Code Areas -- interactive demographic-economic data tables -- create all U.S. ZIP Code areas ACS 2016 5 year estimates dataset -- -- about this feature 11. K-12 Education, Schools & School Districts -- school district interactive demographic-economic data tables -- children's demographics by school district school district profiles -- K-12 Public Schools interactive public schools table -- K-12 Private Schools interactive private schools table -- create Massachusetts all unified school districts ACS 2016 5 year estimates dataset -- -- about this feature 12. Block Groups -- accessing & integrating block group data using API tools 13. Census Blocks -- accessing & integrating census block data using API tools Using these Resources Knowing "where we are" and "how things have changed" are key factors in knowing about the where, when and how of future change -- and how that change might impact you. There are many sources of this knowledge. Often the required data do not knit together in an ideal manner. Key data are available for different types of geography, become available at different points in time and are often not the perfect subject matter. This section is intended to provide access to relevant data and a means to consume the data more effectively than might otherwise be possible. Use data, tools and resources provided/described here in combination with other data to perform wide-ranging data analytics. See examples. Terms of Use Data accessible in this section may be used in reports, analyses and stories. These data may not be redistributed in bulk or as files. There is no warranty of any type associated with any aspect of this section or associated data. The user of this section and associated data is solely responsible for any use, direct or indirect, that might be made of the content. Support Using these Resources Learn more about demographic economic data and related analytical tools. Join us in a Data Analytics Lab session. There is no fee for these one-hour informal Web sessions. The open structure provides for Q&A and discussion of application issues of interest to participants. ProximityOne User Group Join the ProximityOne User Group to keep up-to-date with new developments relating to children's demographics and school district decision-making information resources. Receive updates and access to tools and resources available only to members. Use this form to join the User Group. Additional Information ProximityOne develops geographic-demographic-economic data and analytical tools and helps organizations knit together and use diverse data in a decision-making and analytical framework. We develop custom demographic/economic estimates and projections, develop geographic and geocoded address files, and assist with impact and geospatial analyses. Wide-ranging organizations use our tools (software, data, methodologies) to analyze their own data integrated with other data. Follow ProximityOne on Twitter at www.twitter.com/proximityone. Contact ProximityOne (888-364-7656) with questions about data covered in this section or to discuss custom estimates, projections or analyses for your areas of interest. |
|
|