
|
|
|
Decision-Making Information Web Sessions -- DMI#07 -- Using Geographic Information System Resources
About this Session This session is focused on using Geographic Information System (GIS) tools with an emphasis on use of the Census Bureau TIGER/Line shapefiles and augmented versions in combination with multi-sourced demographic-economic data. Topics covered in this session are intended for those with wide-ranging experience using GIS tools and resources. More advanced users will benefit from specific application topics pertaining to TIGER and accessing/integrating data for geospatial analysis. A "One-to-One" version of this session is available to meet the needs of a specific audience and optionally focused on specific geography, subject matter and application framework. Contact us (mention 1-to-1 dmis07 Web session in text section) or call (888.364.7656) for more information. We have structured this document/session as a combined reference and referral for your post-web session use. We conduct this session every few weeks with periodic updates and changing application focuses. An expanded version of this page is available to members of the ProximityOne User Group. This session makes use of the ProximityOne CV XE GIS and related software. By using these software tools, we are able to support existing user interests and provide common, integrated, software tools for all participants. Any version of the software can be used. Participants who have any version of the software can emulate steps/topics reviewed in this session and expand on topics covered to meet special interests. Optionally use this CV XE GIS installer to install CV XE GIS (no fee) on your Windows-based computer. ProximityOne User Group. members may install any of the Level 1 software tools. • Presenter: Warren Glimpse (about) • This page (being viewed): http://proximityone.com/dmis07_gis.htm • Register (no fee) • 2015 Sessions: ... see list of upcoming sessions ... these sessions cover both basic and a set of new topics Focus this session ... Using Business Site Analysis Tools ... defining and analyzing market/study areas by census block, block group and census tract ... comparing demographic-economic characteristics of alternative site locations ... using these tools, data and methods on your computer; integrating your data ... creating study area maps and demographic reports Updates • Calendar; General Navigation • http://proximityone.com/index.htm (now shows Webinars in top center) • http://proximityone.com/whatsnew.htm (shows new state income page & NY K12 GIS section .. both below) • http://proximityone.com/cv.htm CV XE GIS software • http://proximityone.com/metrodynamics.htm MetroDynamics/MetroProfiles • 2012-13 Public Schools Interactive Table • 2012-13 Local Education Agencies Interactive Table • http://proximityone.com/statetrends.htm (new state income page -- below) • http://proximityone.com/dataresources/guide/index.html?k12_ny_gis_project.htm -- NY 2015 K12 GIS project -- Guide to Data Resources • http://proximityone.com/state_mhi2013.htm -- state income and income inequality measures -- state income and income inequality measures -- blog Selected GIS Projects See the CV XE GIS User Guide for information on navigation, creating map views and geospatial analysis. State Population Estimates & Components of Change Main page: http://proximityone.com/state_pop2014.htm 1. Install the ProximityOne CV XE GIS (only required if not already installed) ... run the CV XE GIS installer ... take all defaults during installation 2. Download the U.S. by State Population 2014 GIS project fileset ... requires ProximityOne User Group ID (join now, no fee) ... unzip U.S. State Population GIS project files to local folder c:\popest 3. Open the c:\popest\stpop2014.gis project ... after completing the above steps, click File>Open>Dialog ... open the file named c:\popest\stpop2014.gis 4. Done. Discuss usage. State-to-State Migration Analysis Main page: http://proximityone.com/state_migration2013.htm 1. Install the ProximityOne CV XE GIS (only required if not already installed) ... run the CV XE GIS installer ... take all defaults during installation 2. Download the U.S. by State Migration 2013 GIS project fileset ... requires ProximityOne User Group ID (join now, no fee) ... unzip U.S. State Migration GIS project files to local folder c:\migration 3. Open the c:\migration\stmig2013.gis project ... after completing the above steps, click File>Open>Dialog ... open the file named c:\migration\stmig2013.gis 4. Discuss usage. Housing Price Index by Metro visual pattern analysis Main page: http://proximityone.com/hpi.htm 1. Install the ProximityOne CV XE GIS (only required if not already installed) ... run the CV XE GIS installer ... take all defaults during installation 2. Download the HPI GIS project fileset ... requires ProximityOne User Group ID (join now, no fee) ... unzip HPI GIS project files to local folder c:\hpigis 3. Open the c:\hpigis\hpi14q3.gis project ... after completing the above steps, click File>Open>Dialog ... open the file named c:\hpigis\hpi14q3.gis 4. Done. Discuss usage. CV XE Start-Up Settings Optional One-time CV XE option settings. With CV XE running use Help>Setting and select Start-up Settings ... add your case-sensitive User Group id (in key edit box) for more features ... modify Start-up GIS Project with default project name; e.g. c:\k12\k12_az.gis (this will always open the specified project at start-up) ... save setting and re-start CV XE GIS See more in CV XE user guide: http://proximityone.com/cvxe/guide/menu_settings.htm Application Projects Session uses GIS projects that are installed with the full CV XE GIS installer. More about these projects. Using GIS Tools & Resources 1. Visual Relationship & Pattern Analysis 1.1. Applications overview using selected GIS projects 1.2. Steps to install and operate 1.3. Pattern Analysis 2. Overview; GIS Projects 2.1. About GIS (PDF) 2.2. The vision: purpose for using a specific GIS project 2.3. GIS project = set of layers with specified attribute settings 2.3.1. Layers - typically representations of shapefiles - tiling graphics; OpenStreetMap 2.3.2. Shapefiles - Point/marker (schools, geocoded addresses) - Lines (street) - Polygon (census blocks, metros, congressional districts) - TIGER/Line shapefiles 3. Using an Existing GIS Project 3.1. Install & start GIS software 3.2. Default GIS project opens/displays: 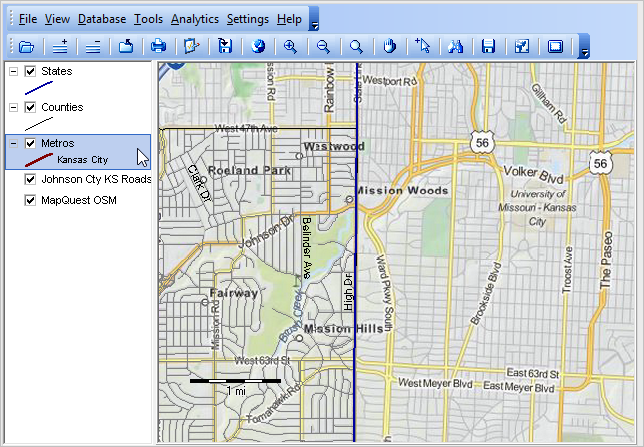 3.3. GUI components: main menu, toolbar, legend panel, map window 4. Main Menu Operations 4.1. File> Opening an existing GIS project guide - File>Open>Dialog: c:\cvxe\1\cvxe_us2.gis - start-up view: 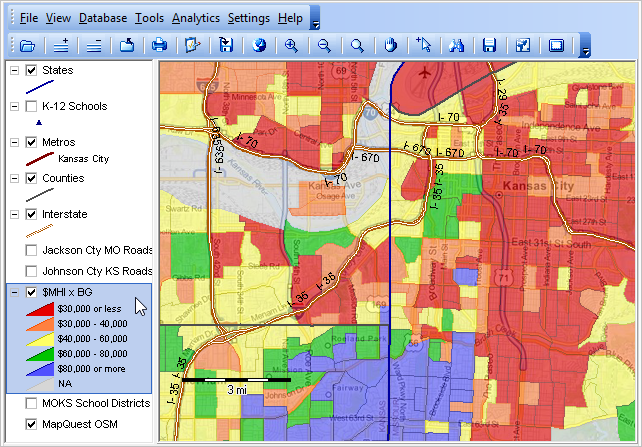 4.2. File> Saving a project 4.3. File> Exporting a shapefile with query 4.3. Database - Shapefile structure; dbase files - Creating/modifying a dbase file -- fields, names and attributes - Browsing a dbase file -- viewing shapefile attributes in tabular form - Integrating/merging dbase files -- adding subject matter to shapefiles 4.4. Settings> Start-up INI guide 5. Toolbar Operations Map navigation and operations -- guide 5.1. Adding and removing layers 5.2. Mouse functions: zoom, pan 5.3. Mouse functions: Identify tool/mini profile guide 5.4. Find Shape 6. Legend Operations 6.1. Using the Legend; active layer guide 6.2. Layer Editor guide - Layer tab - Area tab - Section tab -- setting intervals - Label tab 6.3. OpenStreetMap layer using OSM 7. Map Design & Interpretation 7.1. Map Design - Planning geographic extent for GIS project: world, state, metro? 7.2. Intended uses - Reference & Relationship Maps; ZIP Code & census tract - Thematic Pattern Maps 7.3. Saving map alternative map views: projects versus graphics 8. Creating Custom Maps -- User Group GIS Projects 8.1. Making City Maps 8.2. Making Custom Metro Area Maps 8.3. Examining state by neighborhood patterns of economic prosperity 8.4. Making Custom Congressional District Maps 9. Creating GIS Projects from Scratch 9.1. Start with/open default project -- cvxe_us1.gis project - an illustration of county (Johnson County, KS) block groups and streets - delete all layers except States and OSM 9.2. Selecting/Using TIGER/Line shapefiles 9.2.1. Vintages 9.2.2. Available shapefiles 9.2.3. Optional methods to access and integrate into GIS project 9.3. Add TIGER/Line county by block groups shapefile as layer 9.3.1. about BG shapefile 9.4. Add TIGER/Line edges/roads shapefile as layer 9.4.1. about edges shapefile 9.5. Save project as new name 10. Geocoding and Using Geocoded Data 10.1. Geocoding your address data using APIGeocoder tool ... assign latitude-longitude; census block, census tract, geocodes; demographic-economic attributes ... GIS applications using your geocoded data 11. Site analysis 11.1. using Site Analysis API tool Upcoming Sessions - Register here - Related events Additional Information ProximityOne develops geodemographic-economic data and analytical tools and helps organizations knit together and use diverse data in a decision-making and analytical framework. We develop custom demographic/economic estimates and projections, develop geographic and geocoded address files, and assist with impact and geospatial analyses. Wide-ranging organizations use our tools (software, data, methodologies) to analyze their own data integrated with other data. Follow ProximityOne on Twitter at www.twitter.com/proximityone. Contact us (888-364-7656) with questions about data covered in this section or to discuss custom estimates, projections or analyses for your areas of interest. | |||||
|
| |||||