
|
|
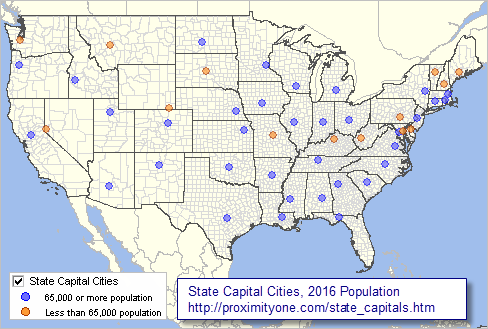
-- Demographic Economic Characteristics & Patterns .. tools and data to examine demographic-economic characteristics of each U.S. State capital city. The profiles part of the America's Communities Program (ACP). The demographic-economic profiles help stakeholders know "where we are", how things are changing where and by how much, and how things might change in the future. See profiles for other cities in the ACP section. State Capital Cities The following graphic shows state capital city locations as markers. This view was developed using GIS tools enabling creation of similar views in context of other geography and subject matter. Orange markers are cities with less than 65,000 population; blue markers are cities with more than 65,000 population. based on percent population change. Click graphic for larger view. Larger view shows city names and urban areas. Expand browser window for best quality view.  .. view developed with ProximityOne CV XE GIS and related GIS project. • Hawaii • Alaska State Capital City Demographic-Economic Profiles State capital cities are listed below organized by state. Click the link within the brackets to view a demographic-economic profile for that city. The 2016 total population is shown in parentheses.
Alabama
Montgomery, AL [0151000] (200,022) Alaska Juneau, AK [0236400] (32,468) Arizona Phoenix, AZ [0455000] (1,615,017) Arkansas Little Rock, AR [0541000] (198,541) California Sacramento, CA [0664000] (495,234) Colorado Denver, CO [0820000] (693,060) Connecticut Hartford, CT [0937000] (123,243) Delaware Dover, DE [1021200] (37,786) District of Columbia Washington, DC [1150000] (681,170) Florida Tallahassee, FL [1270600] (190,894) Georgia Atlanta, GA [1304000] (472,522) Hawaii Honolulu, HI [1571550] (351,792) Idaho Boise City, ID [1608830] (223,154) Illinois Springfield, IL [1772000] (115,715) Indiana Indianapolis, IN [1836003] (855,164) Iowa Des Moines, IA [1921000] (215,472) Kansas Topeka, KS [2071000] (126,808) Kentucky Frankfort, KY [2128900] (27,885) Louisiana Baton Rouge, LA [2205000] (227,715) Maine Augusta, ME [2302100] (18,494) Maryland Annapolis, MD [2401600] (39,418) Massachusetts Boston, MA [2507000] (673,184) Michigan Lansing, MI [2646000] (116,020) Minnesota St. Paul, MN [2758000] (302,398) Mississippi Jackson, MS [2836000] (169,148) Missouri Jefferson City, MO [2937000] (43,013) Montana Helena, MT [3035600] (31,169) Nebraska Lincoln, NE [3128000] (280,364) Nevada Carson City, NV [3209700] (54,742) New Hampshire Concord, NH [3314200] (42,904) New Jersey Trenton, NJ [3474000] (84,056) New Mexico Santa Fe, NM [3570500] (83,875) New York Albany, NY [3601000] (98,111) North Carolina Raleigh, NC [3755000] (458,880) North Dakota Bismarck, ND [3807200] (72,417) Ohio Columbus, OH [3918000] (860,090) Oklahoma Oklahoma City, OK [4055000] (638,367) Oregon Salem, OR [4164900] (167,419) Pennsylvania Harrisburg, PA [4232800] (48,904) Rhode Island Providence, RI [4459000] (179,219) South Carolina Columbia, SC [4516000] (134,309) South Dakota Pierre, SD [4649600] (14,008) Tennessee Nashville, TN [4752006] (660,388) Texas Austin, TX [4805000] (947,890) Utah Salt Lake City, UT [4967000] (193,744) Vermont • Montpelier, VT [5046000] (7,535) Virginia Richmond, VA [5167000] (223,170) Washington Olympia, WA [5351300] (51,202) West Virginia Charleston, WV [5414600] (49,138) Wisconsin Madison, WI [5548000] (252,551) Wyoming Cheyenne, WY [5613900] (64,019) Related Demographic-Economic Interactive Tables Use the national scope demographic-economic interactive tables to view, rank, compare selected or all cities/places (approximately 29,500 places) using an extended set of data as used in the community profiles. The data are based the American Community Survey 2015 5-year estimates and organized into four subject matter groups: General Demographics Social Characteristics Economic Characteristics Housing Characteristics See the related city population trends 2010-2016 interactive table to view, query, rank compare each cities are changing over time. ProximityOne User Group Join the ProximityOne User Group to keep up-to-date with new developments relating to metros and component geography decision-making information resources. Receive updates and access to tools and resources available only to members. Use this form to join the User Group. Support Using these Resources Learn more about accessing and using demographic-economic data and related analytical tools. Join us in a Data Analytics Lab session. There is no fee for these one-hour Web sessions. Each informal session is focused on a specific topic. The open structure also provides for Q&A and discussion of application issues of interest to participants. Additional Information ProximityOne develops geodemographic-economic data and analytical tools and helps organizations knit together and use diverse data in a decision-making and analytical framework. We develop custom demographic/economic estimates and projections, develop geographic and geocoded address files, and assist with impact and geospatial analyses. Wide-ranging organizations use our tools (software, data, methodologies) to analyze their own data integrated with other data. Follow ProximityOne on Twitter at www.twitter.com/proximityone. Contact us (888-364-7656) with questions about data covered in this section or to discuss custom estimates, projections or analyses for your areas of interest. |
|
|