|
|
|
-- demographic-economic-geographic data & analysis America's K-12 education infrastructure includes more than 13,200 regular K-12 school districts. This section provides information about each of these K-12 school districts in context with other data and geography. • All districts interactive table focused on demographic-economic characteristics (based on ACS 2019) • All districts interactive table focused on enrollment and adminstratively reported characteristics (based on CCD 2019) (view, rank, compare all using interactive table below), more than 130,000 K-12 schools and more than 61.8 million school age children. See about news & updates below. New/Updated School District Demographic-Economic Profiles • Illustrative examples: ... Los Angeles Unified & Houston ISD ... Wichita USD KS & Kansas • Request one for your district; use this form .. enter primary & comparison district names in text box. Illustrating side by side comparison of an ESD intersecting with correspondin SSD in Fresno, CA area ... Click to view Alvina ESD CA & Caruthers SSD CA HTML ACS 2019 5-year Caruthers district comprised of two separate parts  Map Geodemographics by Neighborhood in any School District ... via your web browser using the Visual Data Analytics VDA Mapserver ... nothing to install; desktop, laptop or tablet recommended. School District Demographic-Economic Characteristics .. interactive table Examining Patterns of Economic Prosperity by Neighborhood within a School District • The following graphic is focused on Mesa Unified School District, AZ school district (Phoenix area). • Make a map view like this for any school district in minutes. • The colored areas are census tracts; the thematic pattern map shows patterns of median household income. • When any neighborhood is clicked view the demographic profile in the lower left panel. • Follow these steps to create a similar map view for a district of interest. • Join us in a Data Analytics Web Session; every Tuesday; see how VDA operates.  Selected Updates (scroll section) ... 12.15.20. New 2019 Demographic Economic Data for Individual School Districts ... American Community Survey 2019 5-Year Estimates ... data for all U.S. 13,311 districts now available. ... click this link to view a list of all Florida school districts (65,000 population or more). - name of diatrict, total population, median family income. ... Learn more about accessing & using these data .. join us in a Data Analytics Web Session; every Tuesday. 09.17.20. New 2019 Demographic Economic Data for Individual School Districts ... American Community Survey 2019 1-Year Estimates ... data for districts 65,000 population and over; corresponding data for all district available December 2019. ... click this link to view a list of all Florida school districts (65,000 population or more). - name of diatrict, total population, median family income. ... Learn more about accessing & using these data .. join us in a Data Analytics Web Session; every Tuesday. 04.28.20. Characteristics of Grade Relevant Children (GRC) by School District ... annual time series 2010-2018; examining how districts are trending ... data used for ESEA Title I; only source of recent/2018 estimates of GRC for all school districts. ... http://proximityone.com/sdtrends.htm %Grade Relevant Children by School District ... click to view larger; open browser to full window for best quality view  04.09.20. Financing America's Schools ... School District Sources & Uses of Funds ... http://proximityone.com/sdfa17.htm %Federal source of total revenue ... click to view larger; open browser to full window for best quality view  09.22.19. American Community Survey 2018 1-Year Demographic-Economic Estimates ... new 2018 demographic-economic attributes for the 1,038 largest school districts ... American Community Survey 2018 1-Year Tabulation Areas - 09/22/19 ... ACS 2018 (release date 9/26/19) complete geography list/table with data access ... to view list of 1,038 districts, click "School Distict" button below table; table refreshes with school districts list. 08.10.19. Examining the School District Community ... review these recently updated illustrative School District Community sections
San Diego, CA ..
ACS 1-year
.. KS, NY, TX districts include interactive table showing 2018-19 enrollment by grade
Shawnee Mission, KS .. ACS 1-year Wichita, KS .. ACS 1-year Topeka, KS .. ACS 1-year Hewlett-Woodmere, NY Rome City, NY Alief ISD, TX .. ACS 1-year Austin ISD, TX .. ACS 1-year Dallas ISD, TX .. ACS 1-year Edgewood ISD, TX Plano ISD, TX .. ACS 1-year San Antonio ISD, TX .. ACS 1-year Spring, TX .. ACS 1-year for all districts in the state. .. in the above, among other data the left link uses ACS 5-year data; link at right uses ACS 1-year data. .. more about the School District Community. .. request your SDC report; use this form and mention district of interest in text section. 06.10.19. GIS & K-12 Schools ... Kansas statewide GIS project .. ready to use ... see what you can do with these tools ... see video to learn more .. click the "click this link to start video" in that section. ... start using ... installed with no fee CV XE GIS package .. about CV .. run installer ... requires no fee User Group userid .. register here (check CV XE GIS on that form) K-12 Schools in context school districts by median household income  02.02.19. Chesapeake City Schools, VA Geographic-Demographic-Economic Characteristics ... examining the School District Community .. in context of the metro ... a template for use/application to other school districts ... see Chesapeake City Schools Chesapeake City School District Area -- Urban Area & Schools  01.30.19. New U.S. National Scope K-12 School & School District 2016-17 Data ... location attributes, enrollment by grade & program, teacher & staff ... standardized data across all schools & school districts ... interactive tables & GIS/mapping resources Minneapolis-St. Paul, MN area  01.23.19. School District Geography & Geographic Size ... compare, rank, view districts based on geographic size ... interactive table: 2018 School District Geographic Size 01.17.19. School District ACS 2017 Demographic-Economic Characteristics ... All school districts -- interactive tables & GIS/mapping resources ... 4 sections/files .. General Demographics .. Social .. Economic .. Housing San Antonio Metro: School Age Population by School District  01.11.19. School District Demographic Trends; 2010-2017 -- Updated ... examine annual demographic size and change by school district for the period 2010-2017. ... use interactive table to query/rank/compare school districts. ... query by ZIP code, view/analyze districts in one state, county or CBSA/metro. ... interactive table & data access -- http://proximityone.com/sdtrends.htm  11.22.18. School District 2017 Demographic-Economic Characteristics ... interactive tables & GIS/mapping resources ... ACS 2017 1-year estimates; largest 1,042 school districts ... 4 sections/files .. General Demographics .. Social .. Economic .. Housing 10.15.18. ZIP Code Demographics by School District -- Updated ... examine ZIP Code demographics by school district. ... many ZIP codes transcend school district boundaries; ZIP codes may exist in more than one school district. ... view/analyze characteristics of ZIP code areas that intersect with school districts of interest. ... see which school districts are served by a specific ZIP code and associated demographics. ... interactive table & data access -- http://proximityone.com/zip-sd.htm  06.01.18. School Enrollment Projections .. examine how enrollment is projected to change in school(s) of interest .. enrollment by grade annual time series: SY 13-14 through SY 22-23 .. all U.S. approximately 100,000 individual K-12 public schools .. get for one school, all schools in a district .. up to all schools in U.S. .. optionally use with School District GeoDemographic Information System (SDGIS) .. more information: http://proximityone.com/sch2023.htm 05.25.18. New School Attendance Zones .. 2015-16 school year; use in GIS/mapping applications .. use with School District GeoDemographic Information System (SDGIS) .. see related existing school attendance zones SY 13-14 .. contact us for details; enter "SAZ mapping" in text section. 05.21.18. New ACS 2016 School District Special Tabulation annual update .. ACS 2016-based tabulations by children's universes: attributes of total children, grade relevant children enrolled in school; grade relevant children enrolled in public school; grade relevant children enrolled in private school; children not enrolled in school .. see related ACS 2015 SDST data & data analytics tools 05.21.18. School District Sources and Uses of Funds; annual update .. FY 2014 Sources & Uses of Funds .. FY 2015 Sources & Uses of Funds - new 5/21/18 .. FY 2016 Sources & Uses of Funds - new 5/21/18 04.12.18. Baltimore, MD Metro School District GeoDemographic Information System (SDGIS) .. install this ready-to-use GIS project with integrated software .. no fee resources for members of the ProximityOne User Group .. access via http://proximityone.com/mapping-statistical-data.htm Patterns of economic prosperity by block group:  03.09.18. New School District/LEA Interactive Table; SY 2015-16 ... below in this section. 02.22.18. Children's Demographics & Living Environment Interactive Table ... examine children's demographics x school district x type of enrollment universe - total children, grade relevant children (GRC), - GRC enrolled public, GRC enrolled private, GRC not enrolled ... ACS-based school district special tabulation annual update ... unique data & insights into understanding children's living environments by district ... see http://proximityone.com/sdst1115.htm 02.18.18. District Children's Demographics & Living Environment Reports ... click link in scroll section at right to view report. ... Contact us to request report; enter district name in form message section. 12.03.17. School District Demographic Trends: 2010-2016 -- annual update .. time series, annual data for selected items; all school districts .. interactive table & GIS resources; map areas of interest; link with other data .. http://proximityone.com/sdtrends.htm Patterns of 2016 School Age Population in Poverty by School District  02.15.17. K-12 School Characteristics .. tools, data & methodology to examine individual schools .. view, compare, rank, examine peer groups .. U.S. national scope 102.000+ schools; 2014-15 school year .. http://proximityone.com/k12schools.htm schools & school districts; Dallas metro  01.25.17. School District 2015 Demographic-Economic Characteristics ... interactive tables & GIS/mapping resources ... all school districts ... 4 sections/files .. General Demographics .. Social .. Economic .. Housing 12.19.16. School District Demographic Trends: 2010-2015 ... time series, annual data for selected items; all school districts ... new data used as inputs for ESEA Title I 2017 allocations. ... interactive table & GIS resources; map areas of interest; link with other data ... http://proximityone.com/sdtrends.htm Patterns of School Districts with 100,000+ Population  09.16.16. 2015 School District Demographic-Economic Tables ... new 2015 demographic-economic data are now available for larger districts ... latest demographic-economic attributes; district 65,000 population and over ... interactive table and data access/analysis tools -- 1,016 school districts ... http://proximityone.com/sd151dp1.htm -- a set of 4 pages/tables 08.27.16. 2015-16 School District Geographic Characteristics ... new national scope school district shapefiles for mapping & geospatial analysis ... relate districts to counties & metros in interactive table ... view/compare/rank district by geographic size ... interactive table and data access/analysis tools ... http://proximityone.com/sd1516.htm Dallas metro districts, urban area, counties & metro  08.10.16. School District Special Tabulation 2010-2014 ... children's demographic-economic characteristics by school district ... school age population by type of enrollment by district ... interactive table and data access/analysis tools ... http://proximityone.com/sdst1014.htm 06.10.16. School District Source & Uses of Funds FY 2014 ... new data as of June 2016 for each/all public school systems ... join us in the 6/14/16 Data Analytics Lab web session where we the scope, access & use of these data ... see/use school district finances interactive table: ... http://proximityone.com/sdfa14.htm 04.29.16. Texas School District Enrollment Change 2011-12 to 2015-16 ... examine each/all Texas local education agencies by year and 5-year change. ... annual enrollment; interactive table & GIS project ... see http://proximityone.com/tx_sd_2016.htm 03.07.16. Demographic Characteristics of an Area 1-mile from a School ... or 1/2 mile, 2 miles, etc. ... find out using the SiteReport tool ... see http://proximityone.com/sitereport.htm 03.01.16. Options to Access Median Household Income (#MHI) by School District ... "tip of the day" program showing alternative ways to access and use $MHI ... how to get the most up-to-date data. ... illustrates process using $MHI but applies to wide-ranging subject matter ... see http://proximityone.com/schooldistrict_mhi.htm 02.11.16. Local Education Agencies by Type & State ... new 2014-15 school year data ... interactive table & GIS applications ... see http://proximityone.com/lea1415_type_state.htm 01.02.16. School District ACS 2014 5-year Estimates Interactive Tables ... interactive tables, datasets & GIS projects ... General Demographics ... Social Characteristics ... Economic Characteristics ... Housing Characteristics Percent Population 5-17 Years & Over by School District; South Central U.S. 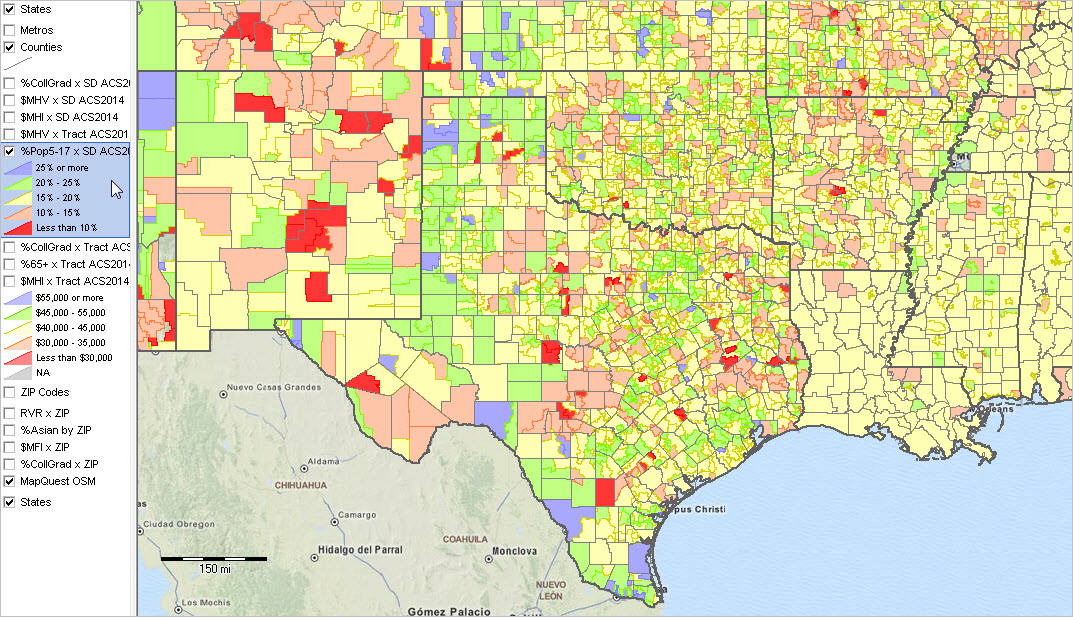 11.05.15. K-12 Data Analytics -- Dallas ISD ... tools, data & methods to analyze schools in context ... apply tools to your districts of interest ... see http://proximityone.com/k12_schools_data_analytics_dallasisd.htm Dallas ISD patterns of poverty by neighborhood; schools; attendance zones; click for larger view  08.24.15. School Attendance Zones; 2013-14 School Year ... national scope school attendance zone boundary files ... see http://proximityone.com/saz.htm ... mapping Hawaii school attendance zones ... join us in a Web session where we review these data and analyses. Spring Branch ISD, TX; click for larger view  08.21.15. Largest 800 School Districts & Detailed Demographic-Economic Profiles ... patterns of change; interactive table; examine peer group ... see http://proximityone.com/lgsd_acs.htm ... join us in a Web session where we review these data and analyses. 07.27.15. Finding Attributes of Schools & School Districts of Interest Use the home page search tool to locate pages referencing a school or school district -- http://proximityone.com ... key-in partial or full name in search box located in upper right corner 07.03.15. School District Demographic-Economic Profiles Examine characteristics, patterns and trends; detailed demographic-economic characteristics More information -- get for your areas; anywhere in U.S. Illustrative set of different types of geography; vicinity of Naperville School District, IL - ZIP Code Area 60565 -- Naperville, IL area - Census Tract 17197880119 -- Naperville, IL area - Naperville city, IL - Naperville School District, IL - DuPage County, IL 06.08.15. Texas School Districts: Enrollment by District by Grade Data Analytics - patterns of change; all districts; enrollment 2010-11, 2014-15, and change - examining largest & fastest growing districts; interactive table, GIS resources; pattern maps - see http://proximityone.com/texas_schooldistricts.htm - join us in a Web session where we review these data and analyses 04.19.15. K-12 Schools & School District Data Analytics - illustrative Data Analytics that can be used for any school district - resources and methods for strategic planning; improving educational opportunities & outcomes - see K-12 Data Analytics 04.10.15. 100 Largest School Districts - 2015 annual update - see 2014 Largest School Districts 01.14.15. All K-12 Public Schools Enrollment & Infrastructure 2012-13 Update - 2012-13 K-12 public schools interactive table - interactive table: http://proximityone.com/k12publicschools.htm - see in GIS applications 01.13.15. All LEA/School Districts Enrollment & Infrastructure 2012-13 Update - 2012-13 Local Education Agency/school districts interactive table - interactive table below in this section - see in GIS applications 01.12.15. Arizona K-12 Schools & School Districts GIS project - examining schools/school districts and neighborhood characteristics - downloadable GIS project & related datasets - 2012-13 school/school districts & attributes - state by census tract integrated ACS 2013 demographic-economic data - see http://proximityone.com/k12_az.htm Patterns of economic prosperity; Mesa Unified in context of Mesa city:  12.17.14. Children in Poverty by School District - 2013 estimates of children in poverty by school district; all U.S. interactive table & GIS resources. - see http://proximityone.com/cip_sd_2013.htm  10.29.14. K-12 Private Schools Update - GIS resources & interactive table - overview & links: http://proximityone.com/k12privateschools.htm 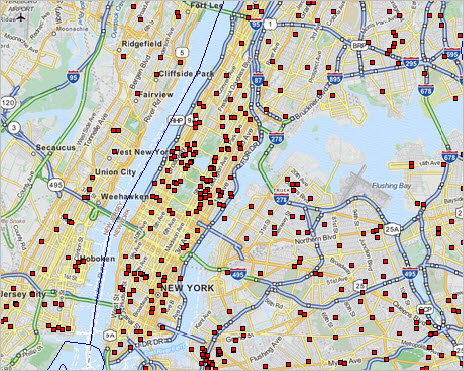 10.08.14. K-12 School Urban/Rural Status based on Census Block - assigning Census 2010 census block code & urban area code to each K-12 school - all schools interactive table: http://proximityone.com/sch1213ua.htm 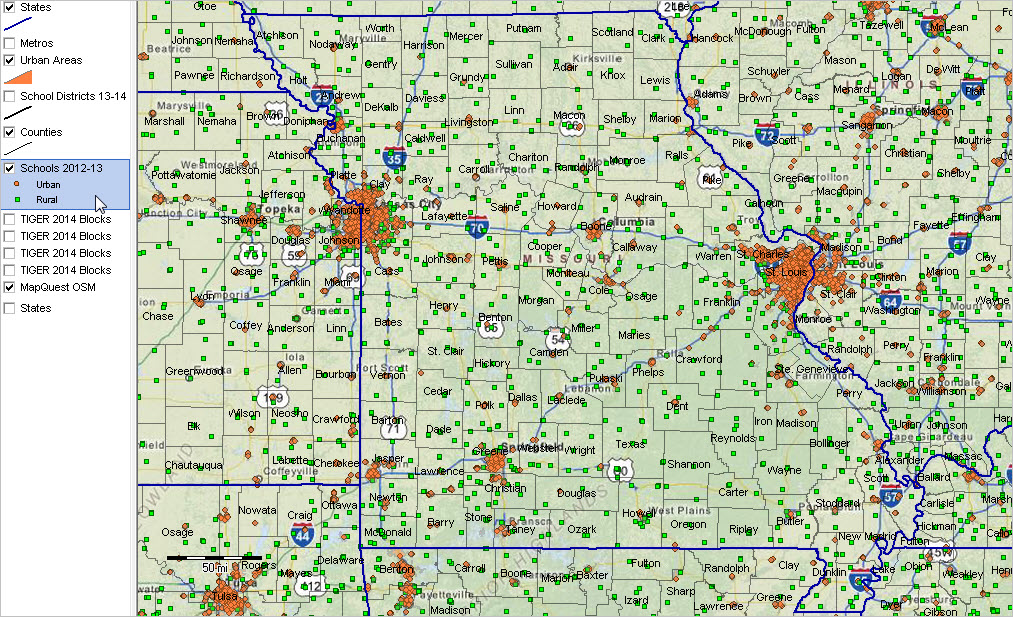 09.18.14. Number of Households by Computer & Internet Access -- by School District • Among largest school districts in 2013, district total households having broadband Internet access ranged from 33.2% (Laredo, TX) to 95.1% (Oswego Community Unit School District 308, IL). • Interactive table & details: http://proximityone.com/computer_use.htm 09.15.14. View School Districts in Context of Google Maps API • Houston, TX area school districts • Other areas 08.20.14. New 2013-14 School District Boundary Files ... new 2013-14 school district boundary files show updated boundaries ... see http://proximityone.com/schooldistricts_2013-14.htm ... Houston ISD, TX 2013-14 boundary (red) compared to 2011-12 boundary (black) ... 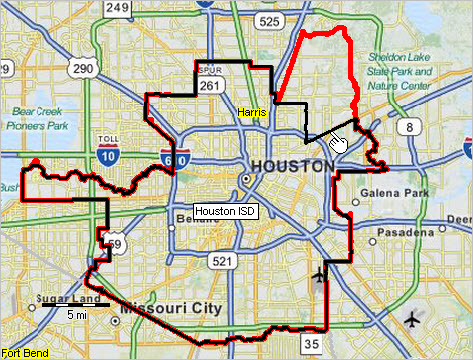 08.08.14. Children in Households by Neighborhood ... examining patterns of children in households by age by block group ... see http://proximityone.com/children_in_households.htm ... 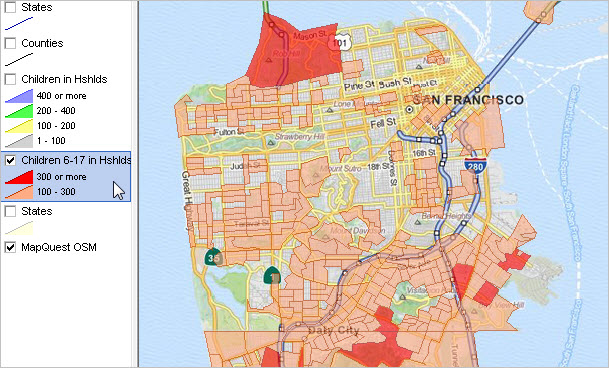 07.11.14. School District Community Demographic-Economic Characteristics ... knowing more about characteristics, patterns and change. ... examples illustrating integration of multi-sourced data... scroll section
GA -- Atlanta Public Schools
MD -- Montgomery County Public Schools MI -- Detroit School District MI -- Okemos Public Schools NY -- Horseheads CSD NY -- Rome CSD TX -- Alief ISD TX -- Austin ISD TX -- College Station ISD TX -- Ector County ISD TX -- Lewisville ISD TX -- McKinney ISD TX -- Midland ISD TX -- Plano ISD 07.09.14. School District Urban, Suburban, Rural Classification & Patterns ... mapping/viewing patterns: school districts by urban-rural locale code ... download GIS resources for further analysis ... markers show urban school districts based on a locale code ... ...  06.12.14. School District Demographic Projections ... new single year of age projections to 2019 by school district. ... see more at http://proximityone.com/schooldistrict_projections.htm 06.01.14. Children's Demographics by School District; 2014 Update ... examine children's demographic-economic characteristics by school district by type of enrollment universe. ... see more at Children's Demographics ... illustrative pattern map; "%Relevant Children Not Enrolled Ages 5-17" by school district with 113th Congressional District boundary overlay; click graphic for larger view and details. ...  04.24.14. 100 Largest School Districts, 2014 Update ... interactive ranking table -- http://proximityone.com/lgsd.htm  03.24.14. School District Comparative Analysis Profiles ... update ... many state by school district sections have been updated ... states just updated (all soon): CA .. GA .. IA .. MO .. NJ .. NY .. NC .. OH .. PA .. SC .. TX ... each school district is a 5-part web page set; side-by-side comparison with state & U.S. ... more at http://proximityone.com/sddep.htm ... see related links to community characteristics: America's Communities Program 02.05.14. School District Comparative Analysis Report/Profiles ... view comparative analysis report/profile for school districts of interest ... side-by-side comparison of one district with other districts, states, U.S. ... what are characteristics of your district? How is it similar/dissimilar? How is it changing? ... see reports: http://proximityone.com/sddep.htm  01.31.14. School District Demographic-Economic Interactive Tables - annual update ... ACS 2012 demographic-economic data for each/all school districts ... view, rank, compare school districts of interest General Demographics . Social Characteristics . Economic Characteristics . Housing Characteristics 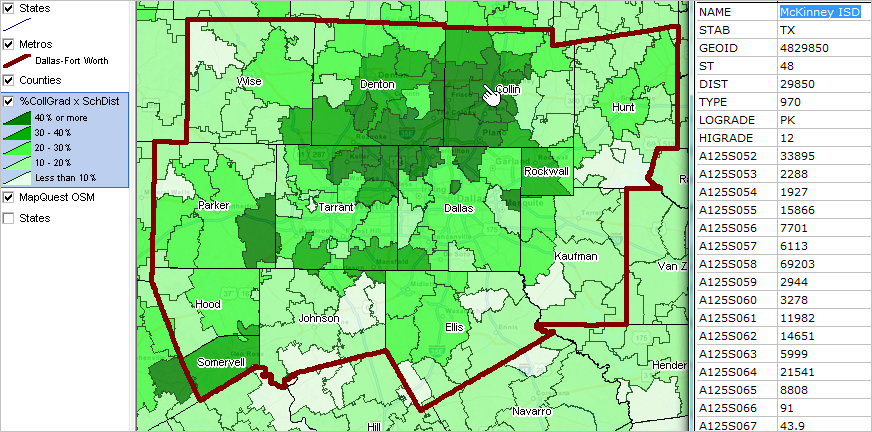 01.06.14. Mapping Poverty in America - neighborhood drill-down within school district ... mapping poverty by census tract & school district ... see about http://proximityone.com/mapping_poverty.htm & GIS/mapping/geospatial analysis ... create your own custom map views: school districts of interest  01.02.14. K-12 Public Schools & Enrollment Characteristics: Interactive Ranking Table ... 104,000+ schools; new data based on school/school district reported data ... see about school comparative analysis profiles & GIS/mapping/geospatial analysis ... use interactive table: http://proximityone.com/k12publicschools.htm  12.20.13. Small Area Disability Demographics ... new data & tools to analyze census tract & higher level disability patterns ... determine special needs population by school vicinity & school district ... school age population examples using Houston ISD, TX...see related DMI Blog ... Harris County, TX: 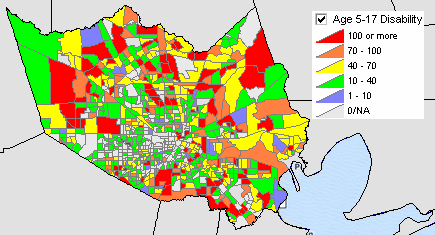 12.15.13. Linguistic Isolation by Block Group ... data & tools to examine households & linguistic isolation measures ... determine multilingual patterns & needs by school vicinity & school district ... examining linguistic isolation patterns by block group ... Queens County, NY: 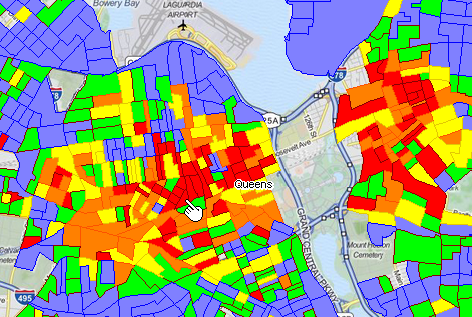 12.13.13. School District 2012 Demographic Estimates ... all school districts; total population, children in poverty by school district ... interactive table: http://proximityone.com/sdpop12.htm 12.06.13. School Attendance Zone Boundary Files & Demographic Analysis ... using school attendance zone shapefiles & demographics ... http://proximityone.com/saz.htm. ... DMI Blog on school attendance zone analysis. ... Join the User Group to start using these resources; join now, no cost. 09.20.13. 2012 Demographic-Economic Estimates for Larger School Districts ... based on ACS 2012; data for wide-ranging areas 65,000 population or more. ... access detailed characteristics by school district using CV XE APIGateway. ... use interactive table providing illustrative data for the 989 largest school districts: - http://proximityone.com/sd_acs12.htm. 09.18.13. Using Site Analysis & GIS Tools to Examine Student & Enrollment Patterns ... analyze geocoded student address/location data in context of streets, schools, attendance zones. ... dynamically create analytical/collaborative views. ... use your confidential data on your computers not accessible by others. - http://proximityone.com/cvxe/guide. 08.23.13. Upcoming ACS 2012 School District Demographic-Economic Profiles ... ProximityOne will develop updated school district demographic-economic profiles later in 2013. ... updated profiles will make use of the American Community Survey (ACS) 2012 data to be released this fall. ... see more about ACS 2012 scope, release dates, and details about forthcoming school district profiles - http://proximityone.com/acs2012.htm. 08.22.13. Making Custom Map Views of School District(s) ... make a custom map of a school district with detailed road/street overlay ... on your computer. ... make map view for one school district or many ... select any school district(s) in U.S. ... automatically create map view on optional OpenStreetLayer base layer. ... optionally overlay other geography such as cities, census tracts, block group, etc. ... get started with the no-fee CV XE GIS Viewer ... use installer ... follow step-by-step tutorial ... example McKinney ISD, TX 04.29.13. ACS 2011 School District Special Tabulation ... children's demographics and their living environment by school district & type of enrollment ... examine characteristics of school age population by enrollment universe: enrolled, enrolled-public, enrolled-private, not enrolled ... updates ACS 2010 estimates http://proximityone.com/sdst0610.htm ... new data interactive table http://proximityone.com/sdst0711.htm 04.01.13. Largest 100 School Districts Updated with 2012-13 Enrollment Data ... 2010-11, 2011-12 & 2012-13 enrollment data updated for largest 100 school districts ... NYC increases; LA Unified and Chicago decline ... interactive table: http://proximityone.com/lgsd.htm 03.25.13. Examining Healthcare, School Age Population & Schools/School Districts ... assessing healthcare resource availability by individual school/school district. ... see how healthcare insurance coverage varies by school district. ... these and related topics at http://proximityone.com/hcdmi.htm 03.19.13. Demographic-Economic Characteristics of Related City-County-Metro ... examine characteristics of cities - counties - metros associated with school/school district location ... U.S. cities/places -- http://proximityone.com/places.htm - includes 2013 metro principal cities ... U.S. counties -- http://proximityone.com/countytrends.htm - includes applicable code for corresponding 2013 metro ... U.S. 2013 metros -- http://proximityone.com/metros2013.htm - new official 2013 metros as defined by OMB 03.15.13. Longitudinal Analysis & Richer Demographic-Economic Data ... summary of annual richer demographic-economic data resources for longitudinal analysis. ... examining demographic-economic trends and patterns for the school district community. ... see http://proximityone.com/sdcommunity.htm#sdctrends 03.07.13. 2011-12 School Year School & School District Data Resources ... summary of selected 2011-12 school year national scope digital map resources available. ... use these data on a school district/community-level up to national scale applications. > national school district boundary shapefile > national school district location & attributes dataset (optionally link with above shapefile) > national school location/point shapefile > national school location & attributes dataset (optionally link with above shapefile) ... Contact us for details (mention 2011-12 school year data in text section) 03.01.13. Potential Impact of Sequester on School Districts ... mapping patterns of school districts by percent revenue from Federal sources. ... view districts most vulnerable to reductions in Federal funding. ... school districts shown in context of 113th Congressional Districts. ... see http://proximityone.com/sdfa_cd.htm 02.25.13. Examining School Age Population in Poverty by Census Tract ... latest estimates of population by poverty status by age by census tract. ... view, query, rank, compare patterns; national scope interactive table. ... examine patterns by school district; example: Austin ISD, Texas ... access & details -- http://proximityone.com/tracts_poverty.htm 02.05.13. ACS 2010 School District Special Tabulation: Updates ... children's demographic and living characteristics by school district. ... new demographic profiles for each/every school district. ... examples Chicago Schools .. Houston ISD .. Los Angeles USD .. New York City Schools .. D.C. ... demographics for school age population by type of enrollment universe. ... all school districts interactive ranking table using 2009-10 boundaries. ... school age children: total, enrolled, enrolled-public, enrolled-private, not-enrolled. ... view your school districts of interest -- http://proximityone.com/sdst0610.htm 02.04.13. S&O Server Now Supports Access to ACS 2011 School District Demographics ... Using APIs, access detailed demographic characteristics for any/all school districts. ... Access same data for related geography; ACS 2011 5-year estimates ... Drill-down to census tract/block group demographics for more neighborhood-like characteristics. ... Application examples & operations: http://proximityone.com/s&o/guide/svr_school_districts.htm 01.18.13. How Urban (or Rural) are School Districts of Interest? ... Views illustrating how urban census blocks can reveal urban/rural make-up of school districts. ... Same process can be used for attendance zones and special purpose or service areas. ... See http://proximityone.com/urbanpopulation.htm#dallas 12.27.12. School District Demographic-Economic Comparative Analysis/Reports ... New resources facilitate strategic planning. ... Examine the latest demographic-economic attributes for any school district. ... About DECA -- http://proximityone.com/deca.htm ... Easily compare attributes of the district to corresponding county and state (or other areas). ... Example: Santa Fe, NM - http://proximityone.com/s&o/profiles/santafe_dpintro.htm 12.15.12. School District ACS 2011 Demographic-Economic Interactive Ranking Tables ... several hundred (600+) most widely used subject matter items; all school districts ... General Demographics -- http://proximityone.com/sd11dp1.htm ... Social Characteristics -- http://proximityone.com/sd11dp2.htm ... Economic Characteristics -- http://proximityone.com/sd11dp3.htm ... Housing Characteristics -- http://proximityone.com/sd11dp4.htm 12.10.12. U.S. & State Elementary-Secondary Education Revenue & Expenditure Patterns ... examine latest national & state revenues & expenditures. ... view/rank/compare sources & uses of funds by category. ... interactive ranking table; aggregates, percentages, per pupil. ... http://proximityone.com/sdfa_state_summary.htm 11.30.12. Analyzing School District Finances using GIS Tools ... examine latest national scope school district finances using GIS tools. ... visually analyze sources & uses of funds by district/region/nation. ... create collaborative views that can instantly show patterns and create insights. ... use related all U.S. school district finances ranking table on same page. ... http://proximityone.com/sdfa.htm#patterns 11.26.12. State Standardized High School Graduation Rates ... State-by-state standardized definition four-year high school graduation rates. ... Use interactive table to compare rates among states for selected student categories. ... For the first time, rates reflect common method of calculation for all states. ... http://proximityone.com/hs_grad_rates.htm
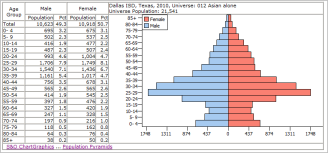
... Dallas ISD, TX example at right; click graphic for larger view. ... Create/analyze/share population pyramids and associated data tables. ... Integrated ready-to-use database; Census 2000 and Census 2010. ... U.S. national scope data: U.S., states, counties; add your own data. ... Age-gender data by extended set of race groups and Hispanic origin. ... http://proximityone.com/populationpyramids.htm 10.17.12. U.S. Public Schools Interactive Ranking Table ... Examine school-level characteristics for 100,000+ schools ... Use interactive ranking table to view/compare/rank individual schools ... View $median household income for the census tract where school located ... Query to view schools by ZIP code, school district, other criteria ... http://proximityone.com/k12publicschools.htm 10.16.12. School Enrollment by State by Age and Type of Enrollment: 2011 ... Examine U.S. trends 2008-2011 based on ACS data ... Use interactive ranking table to view/compare/rank states by type of enrollment ... http://proximityone.com/school_enrollment.htm 10.08.12. School District 2011 Demographic-Economic Interactive Ranking Tables ... New school district demographic-economic estimates released September 2012 ... School districts ... U.S., states, metros/MSAs, counties, cities, congressional districts - view only school districts by selecting SumLev=900 below table - school districts 65,000 or more population; all school districts in December 2012 ... Several hundred most widely used subject matter items from ACS 2011 ... General Demographics -- http://proximityone.com/acs2011dp1.htm - rank on D001 to view largest 10 or 100 districts based on total population ... Social Characteristics -- http://proximityone.com/acs2011dp2.htm - rank on S066 to view districts with highest educational attainment ... Economic Characteristics -- http://proximityone.com/acs2011dp3.htm - rank on E009 to view districts with highest unemployment rates - or E062 to view districts by median household income ... Housing Characteristics -- http://proximityone.com/acs2011dp4.htm - rank on H088 to view districts by median housing value 10.03.12. Video: Using GIS to Examine School Locations & Geographic Relationships ... illustrating school-related GIS application in Houston, TX area ... step by step views of how this type of GIS project can be developed ... next video: using GIS to visually analyze school/neighborhood demographic patterns ... http://proximityone.com/gallery/videos/txschools1.html 09.28.12. Examining Long-term Educational Attainment & School Enrollment ... profiles showing educational attainment & school enrollment by state. ... continuously updated profiles. ... 2000, 2011 and change; in context of related demographic-economic patterns. ... select U.S. or state of interest:
United States
Alabama Alaska Arizona Arkansas California Colorado Connecticut Delaware District of Columbia Florida Georgia Hawaii Idaho Illinois Indiana Iowa Kansas Kentucky Louisiana Maine Maryland Massachusetts Michigan Minnesota Mississippi Missouri Montana Nebraska Nevada New Hampshire New Jersey New Mexico New York North Carolina North Dakota Ohio Oklahoma Oregon Pennsylvania Rhode Island South Carolina South Dakota Tennessee Texas Utah Vermont Virginia Washington West Virginia Wisconsin Wyoming 09.11.12. National Scope K-12 Private Schools ... interactive ranking table ... view/rank/query individual K-12 private schools ... compare/examine characteristics of individual schools ... rank/view largest schools by type in states/areas of interest ... http://proximityone.com/k12privateschools.htm 09.06.12. School Districts by State -- 1952-2012 ... use interactive ranking table to view the number and type of school districts by state. ... examining change in school districts by state infrastructure over the past 60 years. view interactive ranking table http://proximityone.com/sdstate.htm 08.20.12. School District Revenue & Expenditure Patterns ... use interactive ranking table to examine one or a set of school districts. ... compare districts using total, percent and per student data. ... updated with new FY 2010 financial data. view interactive ranking table http://proximityone.com/sdfa.htm 06.19.12. Determining the School District for an Address ... to determine the school district for an address, click here: find school district code. ... enter address & click GO ... school district name appears in geography results display. ... based on 2009-10 school year. 05.22.12. School District Population by Age by Enrollment Universe Profiles ... examine school age population patterns for school districts of interest. ... school district no cost profiles show patterns of age by enrollment universe. ... school age children: total, enrolled, enrolled-public, enrolled-private, not-enrolled. view examples for Houston ISD, TX 05.13.12. ACS 2010 Public Use Microdata Sample (PUMS) Custom Estimates ... create custom demographic estimates pertaining to enrollment & educational attainment. ... estimates by PUMA: Public Use Microdata Areas. ... use PUMS2012 software to develop custom demographic estimates. http://proximityone.com/puma2012.htm 03.28.12. Examining School Districts & Urban/Rural Pattern Change ... Visually examine school district(s) in context of urban areas and changing patterns: see http://proximityone.com/urbanpatterns.htm ... more about Census 2000 and Census 2010 (new March 2012) urban/rural areas see http://proximityone.com/urbanpopulation.htm 03.19.12. Schools, School Districts & the Census Bureau TIGER Web Map Server ... Visually examine distribution/relationship of Census 2010 geography: see http://proximityone.com/cvxe_wms.htm ... drill-down to the census block (11+ million areas) level for anywhere in the U.S. ... view school district boundaries in context of other geography ... integrate views based on your shapefiles with TIGER WMS ... all free. 03.15.12. School District Boundaries & Interactive Google Maps ... examining Colorado school districts with Google maps ... http://proximityone.com/mapping_co_sd.htm 02.02.12. Geocode Student/School Data; View/Analyze in Google Maps ... ProximityOne GMaps no fee, no registration visual analysis tool ... student/school pattern analysis interfaced with Google Maps ... schools & school districts: geocode your student address data ... http://proximityone.com/gmaps/guide 01.06.12. Neighborhood Demographics for Your School of Interest ... get a set of neighborhood demographic profiles for your school of interest ... Census 2010 and ACS 2010 "richer demographics" for school location census tract ... limited time no cost service; one school/profile set per person/organization ... available to schools, school districts, communities and stakeholder organizations ... example: http://proximityone.com/dda/guide/apps_ccisd_tx.htm ... Use this form ... key-in 'neighborhood profile' and school name and address in text section. 12.07.11. Census 2010 Demographics & Schools integrated with Google Maps ... view detailed demographics in vicinity school and neighborhood ... illustration application illustrates use of census tracts, school district & schools ... http://proximityone.com/sd/36/m3614850b.htm 11.29.11. Compare Census 2010 with American Community Survey 2010 1-Year Estimates http://proximityone.com/acs2010.htm ... interactive ranking table ... view/rank/query school districts ... largest 986 school districts (65,000+ population) and wide-ranging other geography. Is Palo Alto Unified, CA the "richest" school district? It is, among the largest districts, based on median housing value and median household income. Use the ranking table to examine districts of interest. 10.21.11. Examine Demographics for Your School District Community ... "richer demographics" school district profiles For all school districts .... use the school district demographic profiles, organized by state, to extend insights into the school district community. Updated annually, these data tell us about school district characteristics including educational attainment, enrollment by type of educational institution/level, workforce and employment, age and gender, place of birth, citizenship status, ancestry, foreign born population, language spoken at home, income and poverty, race/ethnicity, household composition and family structure, housing value and rent, mobility, vehicles, commuting, housing stock and attributes, among others. Click a state link to select district(s). 10.03.11. ESEA Title I 2011 Allocations by School District Examine how 2011 ESEA Title I allocations by school district. Title I of the Elementary and Secondary Education Act (ESEA) is the U.S. government�s largest educational program to assist disadvantaged children. Title I funds programs intended to improve learning for students at risk of educational failure. The interactive ranking table provides allocation data by type of grant and selected measure used to compute allocations. ... Ranking table & data access -- http://proximityone.com/title1_2011.htm. 09.19.11. Analyzing School District Single Year of Age Demographics Examine how single year of age demographics are changing in school districts of interest. Learn more about prospective changes in kindergarten-age, grade 1-age and grade 2-age populations in 2015 and how they compare to today's demographics. See how these data can be organized and viewed at the census block level and for neighborhoods. ... Ranking table & data access -- http://proximityone.com/sdage.htm. 08.10.11 Texas School/School District Performance Analysis Resources TXSDP main section: http://proximityone.com/txsdp.htm  07.12.11 100 Largest School Districts Ranking Table
06.29.11 Tools to Analyze Population by Single Year of Age Variants
07.12.11 100 Largest School Districts Ranking Table
06.29.11 Tools to Analyze Population by Single Year of Age Variantsexamining ages 0-4 ... 5-17 multicultural gender by race-ethnicity characteristics & patterns
05.20.11 Analyzing Children's Demographics: ACS 0509 School District Special Tabulation
05.11.11 Census 2010 Demographic Profile Summary File Data: More Detailed Subject Matter
05.03.11 Examining Hispanic Population by School District
04.29.11 U.S. Births Continue to Decline: U.S. by State Ranking Tables
04.20.11 Census 2010 Group Quarters Data by School District & Attendance Zone
03.31.11 Census 2000-2010 U.S. by School District Population Interactive Ranking Table
03.28.11 National Scope School District Census 2010 PL Summary File
03.10.11 Rank School Districts Based on Census 2010 Demographics
02.22.11 Analyzing School District Demographic Patterns by Census Block
02.08.11 Using GeoDemographics for Strategic Planning and Analysis -- 1-Day Workshops
02.03.11 View School District Demographics from Census 2010 P.L. 94-171 Program
01.25.11 Patterns of Educational Attainment & Economic Prosperity
01.20.11 Census 2010 & School District Redistricting
12.27.10 New School District Demographics for All School Districts
12.15.10 Grade Relevant Children Not Enrolled by District (Dropout Superset)
11.04.10 Updated Largest 100 School Districts Ranking Table
09.15.10 K-12 School & School District Planning: Tools & Tutorial
09.13.10 School Districts by Geographic Size: Ranking Table
08.19.10 Examining & Modifying Attendance Zones
08.18.10 2009-10 School & Local Education Agency Updates
08.17.10 America's High Schools .. characteristics & patterns
08.12.10 ESEA Title I FY 2010 Allocations by District
08.02.10 Metroview Situation & Outlook reports include Schools
07.30.10 College & University Ranking Table
05.12.10 School District Demographic Comparative Analysis
K-12 School Characteristics & Demographics Data Resources
How & When will Decreasing Births Affect K-12 Schools?
Charter Schools by State & Geographic Location
Using the Interactive Table Use the interactive table below to view, query, rank, compare administratively reported characteristics of LEAs. See related School District Demographic-Economic Characteristics Interactive Tables .. 4 sections/files .. General Demographics .. Social .. Economic .. Housing School District Characteristics Interactive Table ... Click on header to sort; click header again to sort other direction. ... Click ShowAll button between queries (resets view/table). ... View additional notes below table. See other interactive tables. Using the Table • See column descriptions below. • Click ShowAll button between queries (resets view/table). • Initial sort order: state FIPS+name • View New York City school district & 32 community school districts (CSDs) - click ShowAll button, key in New York City in the Name> edit box, click Name> button; table refreshes. - see that the CSDs range in size from 7,600 to 61,899 students; examine other characteristics. • Click Type (see below) to select type of LEA. • Filter on Locale: enter 2-digit Locale code in box at right of Locale> then click Locale> button. • Filter on StCty (county): enter 5-digit StCty code in box at right of StCty> then click StCty> button. - StCty codes -- http:/proximityone.com/stcty.txt. • Filter on CBSA (metro): enter 5-digit CBSA code in box at right of CBSA> then click CBSA> button. - CBSA codes -- http:/proximityone.com/metros.htm. • Filter on Name: enter case sensitive exact partial spelling in box at right of Name> then click Name> button, • View Enrollment by Grade columns: click EnrlCols button. • View Enrollment by Race/Ethnicity columns: click RaceCols button. • View All columns: click AllCols button. Column descriptions
Type
1 Regular local school district. Locally governed agency responsible for providing free public elementary or secondary education;
includes independent school districts and those that are a dependent segment of a local government such as a city or county. 2 Local school district .. component of a supervisory union; local school district that shares its superintendent and administrative services with other school districts participating in the supervisory union. 3 Supervisory Union .. performs administrative services for more than one school district providing a common superintendent for participating districts. 4 Regional Education Service Agency. 5 State-Operated Agency. 6 Federally-Operated Agency. 7 Charter Agency. All schools associated with the agency are charter schools. 8 Other Education Agency. Locale code
11 City, Large Territory inside an urbanized area and inside a principal city with population of 250,000 or more.
12 City, Mid-size Territory inside an urbanized area and inside a principal city with a population less than 250,000 and greater than or equal to 100,000. 13 City, Small Territory inside an urbanized area and inside a principal city with a population less than 100,000. 21 Suburb, Large Territory outside a principal city and inside an urbanized area with population of 250,000 or more. 22 Suburb, Mid-size Territory outside a principal city and inside an urbanized area with a population less than 250,000 and greater than or equal to 100,000. 23 Suburb, Small Territory outside a principal city and inside an urbanized area with a population less than 100,000. 31 Town, Fringe Territory inside an urban cluster that is less than or equal to 10 miles from an urbanized area. 32 Town, Distant Territory inside an urban cluster that is more than 10 miles and less than or equal to 35 miles from an urbanized area. 33 Town, Remote Territory inside an urban cluster that is more than 35 miles from an urbanized area. 41 Rural, Fringe Census-defined rural territory that is less than or equal to 5 miles from an urbanized area, as well as rural territory that is less than or equal to 2.5 miles from an urban cluster. 42 Rural, Distant Census-defined rural territory that is more than 5 miles but less than or equal to 25 miles from an urbanized area, as well as rural territory that is more than 2.5 miles but less than or equal to 10 miles from an urban cluster. 43 Rural, Remote Census-defined rural territory that is more than 25 miles from an urbanized area and is also more than 10 miles from an urban cluster. Missing data codes in numeric cells:, -1 -- missing data -2 -- not applicable -9 -- unavailable ProximityOne User Group Join the ProximityOne User Group to keep up-to-date with new developments relating to metros and component geography decision-making information resources. Receive updates and access to tools and resources available only to members. Use this form to join the User Group. Support Using these Resources Learn more about accessing and using demographic-economic data and related analytical tools. Join us in a Data Analytics Lab session. There is no fee for these one-hour Web sessions. Each informal session is focused on a specific topic. The open structure also provides for Q&A and discussion of application issues of interest to participants. Additional Information ProximityOne develops geographic-demographic-economic data and analytical tools and helps organizations knit together and use diverse data in a decision-making and analytical framework. We develop custom demographic/economic estimates and projections, develop geographic and geocoded address files, and assist with impact and geospatial analyses. Wide-ranging organizations use our tools (software, data, methodologies) to analyze their own data integrated with other data. ollow ProximityOne on Twitter at www.twitter.com/proximityone. Contact ProximityOne (888-364-7656) with questions about data covered in this section or to discuss custom estimates, projections or analyses for your areas of interest. |
|
|