
|
05.28.19 Housing Units; U.S., state, county; new 2018 estimates, patterns, trends
... http://proximityone.com/housing_units.htm 05.28.19 Housing Price Index; U.S., state, metro; new 2019Q1 data, over year patterns, trends ... http://proximityone.com/hpi.htm 05.28.19 Statistical Release Dates; general update; adds, mods ... http://proximityone.com/srd.htm 05.28.19 Interactive Tables; general update; adds, mods ... http://proximityone.com/interactive.htm 05.08.19 Metro/CBSA 2018 Population & Components of Change; annual update ... http://proximityone.com/metros.htm 05.02.19 County 2018 Population & Components of Change; annual update ... http://proximityone.com/countytrends2018.htm 11.07.18 Congressional District Main Section Updated ... new interactive table .. Congressional District Seats, Incumbents, Attributes ... progressively updates with Nov 2018 election results 10.17.18 American Community Survey 2017 Updated ... ACS 2017 ... see scope of new data available 03.30.18. State & Regional Decision-Making Information ... state-by-state data resources summary & data access by multiple geographic levels ... http://proximityone.com/srdmi.htm 12.03.17 Census 2020 .. details added 11.16.17 Regional Economic Information System -- REIS Annual Update ... details in S&O calendar 10.15.17 ACS 2016 1-Year Estimates 10.10.17 Census 2010 Summary File 1 - 115th Congressional District Update 09.20.17 School District GeoDemographic Information System Updates .. Austin ISD, TX added 08.18.17 Low & Moderate Income Census Tracts -- HMDA 2017 update 07.30.17 State Trends Main Page -- new sections posted 07.15.17 School District Trends -- districts added; profiles updated 07.20.17 America's Communities Program -- cities added; profiles updated 06.20.17 Census Tracts Main Page .. demographic-economic projections to 2022; interactive tables 06.15.17 Cities/Places Main Page .. America's Communities Program updates 04.15.17 CountyTrends Main Page 03.13.17 Block Group Demographic-Economic Data 02.15.17 Accessing & Using ZIP Code Demographics - tips, tools & data you can use 01.12.17 Housing Price Index by State & Metro - 2016Q3 HPI added; new quarterly change & quarter over year change 01.10.17 School District Geographic Characteristics - new interactive table query operations added 01.03.17 Modeler Predictive Analytics Software - create projections to 2040 01.02.17 Data Analytics Labs -- data access, integration & analysis lab in your organization 12.31.16 ProximityOne Website Structure & Navigation - general update 12.31.16 Mapping Market Area Demographic-Economic Characteristics - update on tools & methods 12.31.16 User Group Program Updates - what's happening in 2017 12.31.16 Location-Based Demographics - find geocodes (census block up) and demographics for an address 12.31.16 Tract Demographic Analytics - API, GIS, & other tools and methods to analyze census tract demographics 12.28.16 User Group Portal - User Group resource/access updates (requires userid join now) 12.22.16 Mapping Statistical Data - new U.S. by State demographic GIS project/fileset 12.22.16 State Trends - new topics, overall update 12.21.16 Data Analytics Blog - topics summary list updated 12.20.16 Children's Demographics, Schools & School Districts 12.19.16 Largest School Districts 12.19.16 Interactive Data Tables - ACS 2015 demographic-economic characteristics x ZIP code - 2010-2015 school district demographic data - State population & components of change 2010-16; new data 12.12.16 Congressional Districts Main Section - link additions & updates 12.10.16 Interactive Data Tables - health characteristics x city/tract addition 12.10.16 Economic Prosperity by ZIP Code Area 12.09.16 Urban Area Demographic-Economic Patterns 12.09.16 America's Urban Agglomerations 12.09.16 America's Urban Population 12.08.16 2015 American Community Survey 5 year estimates new data resources 12/8/16 12.08.16 ProximityOne home page 12.07.16 Metro Situation & Outlook reports - all metros updated 12.07.16 U.S. Voting Population • ProximityOne home page major update/revision • ProximityOne products & services • Weekly Data Analytics Web Sessions • Census 2020 LUCA Program • Situation & Outlook demographic-economic estimates & projections • Low & Moderate Income Demographics/Indicators by Census Tract New Resources & Sections .. scroll section .. goto top 06.28.19. NonEmployer Establishments & Receipts by NAICS; 2017 county level NonEmployer Establishments (businesses with no employees) by type of business U.S. by county interactive table; GIS resources http://proximityone.com/nes17.htm 06.25.19. Quarterly Census of Employment & Wages by NAICS; 2018 annual county level establishments, employment & wages by type of business U.S. by county interactive table; GIS resources http://proximityone.com/qcewa.htm 06.21.19. Situation & Outlook Desktop; Outlook2060 Windows-based integrated software & database availaable to members of the User Group http://proximityone.com/outlook2060a.htm 05.28.19. Housing Price Index; 2019Q1 examining quarter to quarter and over year change in housing value appreciation U.S., State, metros; interactive table; GIS resources http://proximityone.com/hpi.htm 05.27.19. America's Cities Population Estimates; new 2018 annual interactive table; GIS resources http://proximityone.com/places2018.htm 05.27.19. American Community Survey 2018 1-year estimates .. release dates & overview http://proximityone.com/acs2018.htm 05.27.19. American Community Survey 2018 1-year PUMS .. release dates & overview building custom estimates http://proximityone.com/acs2018pums.htm 05.27.19. American Community Survey 2018 5-year estimates .. release dates & overview data to the block group level http://proximityone.com/acs1418.htm 05.27.19. American Community Survey 2018 1-year supplemental estimates .. release dates & overview extended 2018 subject matter for areas 20,000 and over http://proximityone.com/acs2018s.htm 05.27.19. American Community Survey 2018 5-year PUMS .. release dates & overview building custom estimates http://proximityone.com/acs1418pums.htm 05.20.19. Metro Real Personal Income & Related Measures; 2008-2017 annual interactive table; GIS resources http://proximityone.com/metros_rpi.htm 01.15.19 Metro Demographic-Economic Characteristics .. ACS 2017; Interactive Tables .. General Demographics .. Social Characteristics .. Economic Characteristics .. Housing Characteristics 11.24.18. Largest 1,000 School Districts 2017 Demographic-Economic Characteristics interactive tables General Demographics .. Social Characteristics .. Economic Characteristics .. Housing Characteristics 11.12.18. U.S. & State 2017 Birth Characteristics .. interactive table: http://proximityone.com/state_births_2017.htm 11.05.18. Block Group Demographic Data Analytics .. step-by-step use of tools to access block group data from ACS 2016/ACS2017 .. step-by-step building GIS project to develop maps; make thematic patterns maps .. create insights into neighborhood and service area characteristics .. get started: http://proximityone.com/mapping_bgdata.htm 10.31.18. U.S. & State 2017 Demographic-Economic Characteristics interactive tables General Demographics .. Social Characteristics .. Economic Characteristics .. Housing Characteristics 10.22.18 Congressional District 2017 Demographic-Economic Characteristics interactive tables General Demographics .. Social Characteristics .. Economic Characteristics .. Housing Characteristics 06.20.18 School Enrollment Projections by Grade to 2023 .. time series annual data for each of approximately 100,000 K-12 schools .. http://proximityone.com/sch2023.htm 06.14.18 New School Attendance Zones Shapefiles & Demographics .. covering more than 12,000 school districts; SY 2015-16; interactive table & GIS tools/geospatial analysis .. http://proximityone.com/saz.htm 06.07.18 City/Place Population Estimates Annual Time Series; 2010-2017 .. 19,500 cities/places; interactive table & GIS tools/geospatial analysis .. existing section updates on this date 05.28.18 Housing Units Annual Time Series; 2010-2017 annual update .. interactive table (U.S., metro, county) & GIS tools/geospatial pattern analysis .. http://proximityone.com/housing_units.htm 05.10.18 Naturally Occurring Retirement Communities (NORC) updates .. updates using ACS 2016 .. patterns by census tract .. http://proximityone.com/norc2016.htm 04.25.18. County Business Patterns 2016 ... tools to examine business establishment patterns by county by type of business ... interactive table & GIS/mapping/geospatial analysis applications ... see http://proximityone.com/cbp2016.htm 04.12.18. Location-Based Demographics (LBD) ... find demographics & geocodes (ZIP code and other) for an address ... create area profiles for areas containing address; export to spreadsheet/HTML ... no fee tool: start using the Location-Based Demographics tool 03.30.18. How & Why State Demographics are Changing ... national scope interactive table; state-by-state sections ... http://proximityone.com/countytrends2017.htm 03.05.18. Foreign Born Population by Census Tract by Country of Origin ... national scope interactive table; examine foreign born communities by metro ... http://proximityone.com/foreignborn.htm 02.07.18. ZIP Code Multi-Sourced Demographic-Economic-Business Profiles ... structured profiles for individual ZIP codes; updating as new data become available ... ACS 2015 & 2016 data (all subject matter items in above tables) with selected ACS 2011 items ... HPI and ZIP Business Patterns establishment data by 3-digit NAICS/type of business - full 6-digit NAICS detail for Health Services sector ... integrated map graphic relating ZIP code and census tract boundaries ... selection of ZIP code profiles; pick from list -- http://proximityone.com/zip16dp1.htm#profiles - example: ZIP 10514 (Westchester County, NY) http://proximityone.com/profiles/1/zip_1516_10514.htm 02.07.18. U.S. ZIP Code ACS 2016 5-year Demographic-Economic Interactive Tables ... view, rank, compare ~33,000 cities/places ... associate ZIP codes with corresponding county, metro and peer groups ... general demographics - http://proximityone.com/zip16dp1.htm ... social characteristics - http://proximityone.com/zip16dp2.htm ... economic characteristics - http://proximityone.com/zip16dp3.htm ... housing characteristics - http://proximityone.com/zip16dp4.htm 01.30.18. Data Privacy & Statistical Data Development ... topics on Privacy-Loss Budget & How used to Design Privacy Protection for Confidential datasets ... http://proximityone.com/data_privacy.htm 01.28.18. U.S. Cities/Places ACS 2016 5-year Demographic-Economic Interactive Tables ... view, rank, compare ~29,500 cities/places ... associate cities/places with corresponding metro and peer groups ... general demographics - http://proximityone.com/places16dp1.htm ... social characteristics - http://proximityone.com/places16dp2.htm ... economic characteristics - http://proximityone.com/places16dp3.htm ... housing characteristics - http://proximityone.com/places16dp4.htm 01.24.18. 2018 Statistical Release Dates ... release dates for underlying data used in ProximityOne Situation & Outlook Program ... http://proximityone.com/statistical-release-dates.htm 01.15.18. U.S. Metros/CBSAs ACS 2016 1-year Demographic-Economic Interactive Tables ... view, rank, compare ~520 largest Metros/CBSAs ... associate corresponding state and peer groups ... general demographics - http://proximityone.com/cbsa161dp1.htm ... social characteristics - http://proximityone.com/cbsa161dp2.htm ... economic characteristics - http://proximityone.com/cbsa161dp3.htm ... housing characteristics - http://proximityone.com/cbsa161dp4.htm 12.03.17. School District Demographic Trends: 2010-2016 -- annual update ... time series, annual data for selected items; all school districts ... interactive table & GIS resources; map areas of interest; link with other data ... http://proximityone.com/sdtrends.htm Patterns of 2016 School Age Population in Poverty by School District  10.15.17. Using API Tools to Access ACS 2016 1 Year Data .. creating national scope datasets with simple commands 10.09.17. CV XE GIS GeoGateway .. updated, supporting Digital Map Database 2017 10.07.17. Digital Map Database - TIGER 2017 annual update .. intersection to intersection street segment geography 09.27.17: State of the States: 2016 Demographic-Economic Characteristics .. General Demographics .. Social .. Economic .. Housing 09.22.17: 115th Congressional Districts 2016 Demographic-Economic Characteristics .. General Demographics .. Social .. Economic .. Housing 09.01.17. Important Upcoming Geographic/Statistical Data Releases ... September 2017 ... see http://proximityone.com/updates090117.htm 07.30.17. State Quarterly GDP by Industry ... interactive table and GIS analytical resources ... see http://proximityone.com/stategdpq.htm 07.10.17. Appalachia Demographic Economic Patterns & Trends ... data and tools to examine Appalachia region. ... http://proximityone.com/appalachia.htm 06.23.17. American Community Survey 2016 -- looking ahead ... these new sections will progressively update in weeks ahead. ... ACS 2016 1-year estimates ... ACS 2016 5-year estimates 06.22.17. Census Tract Demographic-Economic Projections to 2022 ... annual estimates & projections U.S. by census tract, 2010-2022 ... Tract Estimates-Projections 06.20.17. Census Tract ACS 2015 Demographic-Economic Interactive Tables ... 4 sections/files .. General Demographics .. Social .. Economic .. Housing ... access to table requires User Group ID. Join now. No fee. 06.17.17. America's Communities Program ... demographic-economic profiles for America's Cities ... America's Cities 06.15.17. Metro Population & Components of Change Estimates; 2010-2016 ... tools to examine annual population and components of change ... interactive table & GIS resources ... http://proximityone.com/metrotrends2016.htm ... access to table requires User Group ID. Join now. No fee. 05.27.17. City/Place Population Patterns & Trends: 2010-2016 ... annual population estimates for all cities; 2010-2016 ... interactive table & GIS tools ... see http://proximityone.com/places2016.htm Patterns of City Population Growth %Change 2010-2016  05.24.17. Business Data Information System ... quarterly financial time series & related data for individual businesses ... tools & data to examine individual business SEC filer data ... http://proximityone.com/bdis.htm 05.20.17. Relating ZIP Code Areas to Cities/Places ... tools & data to examine ZIP code/place geodemographics ... http://proximityone.com/zcta-place.htm 05.17.17. State Population & Household Projections to 2030 ... population, components of change & households ... vintage "2017A" annual estimates & projections updates ... see: http://proximityone.com/outlook2030_states.htm Store Locations in the Dallas, TX Area  05.09.17. Health Data Analytics - Life Expectancy ... data & tools to examine changing life expectancy by county -- 1980-2014 ... see: http://proximityone.com/hda_life_expectancy.htm Store Locations in the Dallas, TX Area  04.25.17. Congressional Districts - State Legislative Districts Group & Forum ... join in! ... topics on voting districts, congressional districts, state legislative districts data and analytical tools, methods ... CDSLD main page: http://proximityone.com/cdsld.htm 04.23.17. 115th Congressional Districts: Analysis and Insights ... interpretative data analytics; tools, data & methods ... interactive table: extended demographic with party & incumbent details ... see: http://proximityone.com/cd115.htm Charlotte NC-SC Metro Area with 114th/115th Congressional District 12  04.21.17. Creating Location/Address/Point Shapefiles ... GIS tools and methods to develop and update location/address shapefiles ... create point shapefiles; automatically assign census block code ... see: http://proximityone.com/creating_location_shapefiles.htm Store Locations in the Dallas, TX Area  04.20.17. Houston Metro Demographic-Economic Characteristics ... tools & data; view/rank/compare/analyze conditions & trends ... metro focused ready-to-use GIS project/datasets ... available for any metros ... see: http://proximityone.com/metros_houston.htm Patterns of economic prosperity by Houston neighborhood:  04.16.17. GISNews Group & Forum ... join in! ... topics on GIS tools, methods, geostatistical data and data analytics ... GISNews main page: http://proximityone.com/gisnews.htm 04.15.17. County Income & Income Inequality 5-Year Patterns ... comparing patterns based on ACS 2010 & ACS 2015 ... interactive table & GIS applications ... see: http://proximityone.com/countytrends_mhigini.htm Patterns of Income Inequality by County; ACS 2015:  04.12.17. Creating Custom School District Maps ... tools & data to map & geospatially analyze school districts ... ready-to-use state-by-state GIS projects ... see: http://proximityone.com/mapping_school_districts.htm Patterns of Economic Prosperity by School District:  04.04.17. State/County Demographic-Economic Interactive Tables ... Includes all counties with CBSA/metro code .. ACS 2015 5-year estimates ... General Demographics .. Social Characteristics .. Economic Characteristics .. Housing Characteristics 03.27.17. County Urban Rural Characteristics ... Census 2010 compared to 2016 ... interactive table & GIS applications ... see: http://proximityone.com/county_urban_rural.htm Counties by Percent Urban Population; Census 2010:  03.23.17. City/Place Demographic-Economic Interactive Tables Based on ACS 2015 5-year estimates 29,000+ cities/places with CBSA/metro code .. General Demographics .. Social Characteristics .. Economic Characteristics .. Housing Characteristics determining block groups touching a custom defined geographic area  03.14.17. CV XE GIS Shp2Shp Geographic Relationship Tool ... creating geographic equivalence files relating data from two different shapefiles ... http://proximityone.com/shp2shp.htm determining block groups touching a custom defined geographic area  03.08.17. Monthly Building Permits ... tools, data & methodology to examine individual cities, counties and metros ... view, compare, rank, examine peer groups ... 2016 by month; monthly updates ... http://proximityone.com/bp.htm visual building permit pattern analysis  03.01.17. Jobs-to-Housing Ratio; Employment & Housing ... tools, data & methodology to examine individual cities, counties and metros ... view, compare, rank, examine peer groups ... http://proximityone.com/ehp.htm visual analysis of jobs to households ratio patterns  02.15.17. K-12 School Characteristics ... tools, data & methodology to examine individual schools ... view, compare, rank, examine peer groups ... U.S. national scope 102.000+ schools; 2014-15 school year ... http://proximityone.com/k12schools.htm schools & school districts; Dallas metro  02.06.17 Housing Value Change Data Analytics by 3-Digit ZIP Code ... housing value appreciation by 3-digit ZIP Code ... 2015Q3-2016Q3 Housing Price Index interactive table & GIS resources ... updated quarterly ... http://proximityone.com/hpizip3.htm 01.30.17. Improving Competitive Advantage Workshops ... one-hour Web sessions ... tools, data & methods to improve competitive advantage. ... http://proximityone.com/caw.htm 01.30.17. National Children and Education Statistics Program ... extensive, multi-sourced, integrated updating demographic-economic data ... children's demographics; school, school district, K-12 education statistics. ... interactive tables, GIS resources, analytical tools ... http://proximityone.com/nces.htm 01.30.17. School District Demographic-Economic Profiles ... individual school district characteristics and patterns ... based on selected NCES data resources. ... Example: Alexandria Public Schools, VA 01.14.17. Analyzing Consumer Expenditure Patterns ... using data from the Consumer Expenditure Survey. ... interactive table and developing consumer expenditure data for wider array of geography. ... http://proximityone.com/cep.htm 01.12.17. 2017 Events & Geographic/Statistical Data Release Dates Calendar ... query list-oriented calendar to view events & statistical release dates ... coordinated with monthly calendar view; set reminders ... http://proximityone.com/calendar.htm 01.09.17. Urban Area Demographic Trends 2010-15 ... examine urban areas in context of metros ... interactive table and GIS resources ... http://proximityone.com/urbantrends.htm Houston, TX Urbanized Area in context of metro  01.03.17. Modeler Level 1 Predictive Analytics Software ... create your own proprietary demographic-economic estimates & projections ... create alternative scenario U.S. by state projections to 2040 ... population and components of change annually 2010 through 2040 ... use output with any analytical software such as Excel or CVGIS Mapping & Data Analytics ... http://proximityone.com/modeler_level1.htm California annual data; partial view  01.01.17. Creating Maps & GIS Projects ... create custom maps from scratch; drill down to intersection/census block ... view neighborhoods; market areas; add your data ... using no fee GIS tools & no fee data resources ... http://proximityone.com/maps.htm University Park, TX; Dallas Metro area  12.22.16. Examining U.S. by State Population & Population Change ... using new (released 12/16) state population and components of change data ... http://proximityone.com/states2016.htm ... interactive table and GIS/mapping resources; annual data 2010-2016 Patterns of population change by state 2010-2016  12.19.16. School District Demographic Trends: 2010-2015 ... time series, annual data for selected items; all school districts ... interactive table & GIS resources; map areas of interest; link with other data ... http://proximityone.com/sdtrends.htm Patterns of School Districts with 100,000+ Population  12.14.16. ACS 2015 ZIP Code Demographic Economic Updates ... interactive table & GIS resources; map areas of interest; link with other data ... http://proximityone.com/zip2015.htm Patterns of $MHI by Tract & ZIP Code Dallas metro Area  12.10.16. Examining Health Characteristics by Census Tract ... new health characteristics by census tracts; previously non-existing data by city/tract ... interactive table & GIS resources; map areas of interest; link with other data ... http://proximityone.com/health_tracts.htm Patterns of Coronary Heart Disease by Tract; Charlotte, NC-SC Area  12.06.16. 2016 Presidential Election; Voting & Citizen Voting Age Population ... U.S. by county; votes by party; voter participation ... interactive table & GIS resources; map areas of interest; link with other data ... http://proximityone.com/elections2016.htm 2016 Presidential Election Vote by County vote as a percent of the citizen voting age population  11.25.16. Population Groups -- Characteristics & Trends ... navigation tool providing list of selected population group Web sections ... http://proximityone.com/population_groups.htm 11.20.16. Regional Economic Information System REIS Annual Update ... U.S. by County economic database; times series 1969-2015 ... 31 item economic profile each county/state ... interactive table & GIS resources; http://proximityone.com/reis.htm ... new 2015 annual updates; integrated into S&O projections to 2030 2015 County $PCPI relative to U.S. 2015 $PCPI  11.10.16. State & Regional Income & Product Accounts SRIPA ... State & Regional counterpart to National Income & Product Accounts (NIPA) ... http://proximityone.com/sripa.htm ... component of S&O database 11.05.16. Personal Consumption Expenditures (PCE) by State ... U.S. by State PCE by Category time series ... interactive table & GIS resources; http://proximityone.com/pce.htm ... new 2015 annual updates; integrated into S&O projections to 2030 Personal Consumption Expenditure by Category  11.01.16. Metro Gross Domestic Product Metro GDP Annual Update ... U.S. by MSA GDP by Sector time series ... interactive table & GIS resources; http://proximityone.com/metrogdp.htm ... new 2015 annual updates; integrated into S&O projections to 2030 Change in Per Capita Real GDP by Metro, 2010-2015  10.31.16. Analyzing the Local Area Employment Situation ... monthly updates on the employment-unemployment characteristics ... updated through August 2016 w/over the year change; interactive table; downloadable GIS resources ... view these updates integrated into individual metro reports ... see http://proximityone.com/laes.htm Unemployment Rate by Metro  10.22.16. Examining State Diversity 2015 ... http://proximityone.com/diversity2015.htm ... State Diversity Index 2015; interactive table with related race/origin pattern data; GIS/mapping resources State Diversity Index by State & Patterns of %NonWhite Population  10.19.16. Mapping Census Tract Demographics ... http://proximityone.com/mapping_tract_demographics.htm ... map any county by census tract; choose your own subject matter Patterns of Economic Prosperity by Census Tract; Dallas County, TX  09.30.16. 2015 Congressional District Demographic-Economic Interactive Tables ... General Demographics ... Social Characteristics ... Economic Characteristics ... Housing Characteristics patterns of educational attainment by congressional district ...  09.16.16. 2015 School District Demographic-Economic Interactive Tables ... new 2015 demographic-economic data for largest districts ... latest demographic-economic attributes; district 65,000 population and over ... interactive table and data access/analysis tools -- 1,016 school districts ... http://proximityone.com/sd151dp1.htm -- a set of 4 pages/tables 09.12.16. Establishments, Employment & Wages 2016Q1 Update ... quarterly establishment, employment & wage data by sector ... U.S., state, metro, county; interactive table; downloadable GIS resources ... view these updates integrated into individual metro reports ... see http://proximityone.com/eee.htm Where America makes things ...  09.10.16. 2015 American Community Survey ... new 2015 demographic-economic data ... access, integration & interpretation guides & tools ... http://proximityone.com/acs2015.htm 09.09.16. Metro New Residential Construction ... monthly updates; interactive table & GIS project/datasets ... downloadable GIS resources ... view these updates integrated into individual metro reports ... see http://proximityone.com/metro_residentialconstruction.htm Patterns of New Authorized Residential Units by Metro  08.27.16. State & Metro Buying Power Index ... metro by metro: what will $100 buy? ... interactive table & GIS resources ... view/compare/rank states & metro indexes by type of goods & services ... see http://proximityone.com/buyingpower.htm Dallas metro districts, urban area, counties & metro  08.22.16. 2015-16 School District Geographic Characteristics ... new national scope school district shapefiles for mapping & geospatial analysis ... relate districts to counties & metros in interactive table ... view/compare/rank district by geographic size ... see http://proximityone.com/sd1516.htm Dallas metro districts, urban area, counties & metro  08.18.16. 2016 Census Block Shapefiles ...Using census block geodemographics: Census 2010 & 2016 updates ... 11.6 million blocks comprising 12.2 GB available in ready-to-use structure; download/DVD. ... 1) complete shapefiles, 2) database component only, 3) optional integrated demographics. ... see more about http://proximityone.com/tiger2016_blocks.htm. 08.16.16. TIGER 2016 Digital Map Database ... updated road shapefiles for every county in the U.S. ... new official January 1, 2016 boundaries/shapefiles for cities, school districts, 115th congressional district and more. ... corresponding boundaries/shapefiles for statistical/political geography to the census block level. ... TIGER 2016 main: http://proximityone.com/tiger2016.htm ... road data access & coverage: http://proximityone.com/tiger2016_roads.htm 08.10.16. School District Special Tabulation 2010-2014 ... children's demographic-economic characteristics by school district ... school age population by type of enrollment by district ... interactive table and data access/analysis tools ... http://proximityone.com/sdst1014.htm 07.26.16. ACS 2014 1-year "Supplemental" Estimates ... 1-year estimates for areas 20,000 population or more ... interactive tables and data access/analysis tools ... many areas for which only 5-year estimates were previously available, now have 1-year estimates available. ... http://proximityone.com/acs2014s.htm 07.25.16. Metro Situation & Outlook Reports Updated ... county profiles for each county in metro; all U.S. metros ... annual data; components of change; race/origin characteristics ... single year of age 0, 1, 2, ... 84, 85 up; selected age groups ... access metro report via column 3 ("Code") in table: http://proximityone.com/metro_reports.htm .. then click county links in section 4.2. 07.25.16. State & Regional Decision-Making Information Pages Updated ... new/updated county profiles for each county in state ... annual data; components of change; race/origin characteristics ... single year of age 0, 1, 2, ... 84, 85 up; selected age groups ... access state by state SRDMI pages: http://proximityone.com/srdmi.htm .. select a state, then see section 7; click county link. 07.25.16. State Trend Profiles 2010-2015 ... individual state profiles; all U.S. ... annual data; components of change; race/origin characteristics ... single year of age 0, 1, 2, ... 84, 85 up; selected age groups ... click state link in scroll section: http://proximityone.com/stateage.htm 07.25.16. County Demographic Trend Profiles 2010-2015 ... individual county profiles; all U.S. ... annual data; components of change; race/origin characteristics ... single year of age 0, 1, 2, ... 84, 85 up; selected age groups ... click county link in table: http://proximityone.com/countytrends2015.htm 07.18.16. Daytime Population & Commuter Flows by Census Tract ... tools to examine daytime population & commuter flows by census tract ... See http://proximityone.com/daytime_population_tracts.htm Patterns of Daytime Population Census Tract  07.10.16. State & Metro Price Parities; 2008-14 ... interactive table & GIS tools/applications ... See http://proximityone.com/rpp.htm Regional Price Parities by Metro: 2014  07.02.16. Housing Price Index by 5-Digit ZIP Code; 2010-2015 ... interactive table & GIS tools/applications ... See http://proximityone.com/hpizip.htm Housing Value Change by ZIP Code: 2010-15  07.02.16. Housing Price Index 2015Q1-2016Q1 Update ... quarterly HPI by ZIP Code, metro, state & U.S. ... interactive table & GIS tools/applications ... See http://proximityone.com/hpi.htm Housing Price Change by Metro 2015Q1-2016Q1  06.30.16. Real Gross Domestic Product by State and Area: 2010-2015 ... interactive table & GIS tools/applications ... See http://proximityone.com/gdp.htm Per Capita Real GDP & Percent Change by State  06.24.16. State Demographic-Economic Briefing Notes ... state and area sections providing a narrative summary of more detailed data in the RDEMS database/tables ... key demographic-economic characteristics & trends for states and areas ... provided in context with related U.S./national corresponding data and change ... http://proximityone.com/rdems.htm 06.10.16. School District Source & Uses of Funds FY 2014 ... new data as of June 2016 for each/all public school systems ... join us in the 6/14/16 Data Analytics Lab web session where we the scope, access & use of these data ... see/use school district finances interactive table: ... http://proximityone.com/sdfa14.htm 06.06.16. County New Residential Construction: 2014-2015 ... number & value of new residential units authorized by type ... interactive table -- http://proximityone.com/county_residentialconstruction.htm 06.03.16. Regional Demographic-Economic Modeling System ... examine demographic-economic characteristics, patterns and trends for county & sub-county areas ... interactive access -- http://proximityone.com/rdems.htm 05.24.16. City/Place Demographic-Economic Interactive Tables Based on ACS 2014 5-year estimates Include all 29,000+ cities/places; principal city records/rows include CBSA/metro code ... General Demographics ... Social Characteristics ... Economic Characteristics ... Housing Characteristics 05.20.16. City/Place Population Patterns & Trends: 2010-2015 ... annual population estimates for all cities; 2010-2015 ... interactive table -- http://proximityone.com/places2015.htm 05.18.16. City/Place Data Analytics and Demographic-Economic Data ... view reports & tables; create state by city/place data files ... state-by-state demographic-economic characteristics and patterns ... select a state: http://proximityone.com/metro_reports.htm 05.17.16. Metro Situation & Outlook Reports Updated ... monthly labor force characteristics: through March 2016 added ... click metro code in this table to view metro report ... individual metros: see http://proximityone.com/metro_reports.htm 05.16.16. Census Tract-City-County Relationship Interactive Table ... 72,000+ tracts equivalenced to 29,000+ cities/places (and counties) ... interactive table: view, sort, query, locate geographic relationships & codes ... see: http://proximityone.com/tract_place.htm 05.10.16. Census Tract Data Analytics ... alternative methods & tools to access & use census tract geographic, demographic, economic data ... see: http://proximityone.com/tract_data_analytics.htm  05.05.16. CVXEGIS dBase Script Tool ... new feature provides for programming-like code to process dBase files ... available in the no fee version of CVXEGIS ... see more about the Script tool ... install CVXEGIS on any Windows computer 04.22.16. County Business Patterns 2014 ... examining county employment, establishments & and payroll patterns ... county level data tabulated for up to 2,000 types of business ... interactive table & GIS tools/datasets ... see: http://proximityone.com/cbp14.htm  03.28.16. County Population Trends 2010-2015 ... examining components of change and metro by county characteristics ... answers to the how and why of population change since 2010 ... interactive table & GIS applications ... see: http://proximityone.com/countytrends2015.htm  03.08.16. Low and Moderate Income Demographics by Block Group ... national scope all U.S. by block group interactive ranking table ... developing site analysis reports; GIS project & datasets ... see http://proximityone.com/lmisd.htm Patterns of low & moderate income by block group  03.07.16. Demographic Characteristics of an Area 1-mile from an Address or Location ... or 1/2 mile, 2 miles, 5 miles, 20 miles, etc. ... find out using the SiteReport tool ... see http://proximityone.com/sitereport.htm 03.04.16. U.S. Demographic-Economic Characteristics ... extended table showing most recent demographic-economic characteristics for the U.S. and other areas ... see us_characteristics.htm 02.22.16. Analyzing County Group Quarters Population ... interactive table & GIS applications based partly on Census 2010 SF1 ... see: http://proximityone.com/group_quarters..htm  02.19.16. Academy Awards, Hollywood & Statistics ... data about Hollywood and from Hollywood ... characteristics of famous celebrity census respondents ... see: http://proximityone.com/hollywood-statistics.htm  02.11.16. Local Education Agencies by Type & State ... new 2014-15 school year data ... interactive table & GIS applications ... see http://proximityone.com/lea1415_type_state.htm 02.08.16. Census 2020 of Population & Housing ... new Web section focused on Census 2020 to be conducted April 1, 2020 ... what you need to know and how you may be involved extends well beyond data access & analysis ... see http://proximityone.com/cen2020.htm 02.05.16. Relating Addresses to Digital Road Segments ... using API & GIS tools to relate address/location to digital road segments ... apply these resources to any U.S. address of interest ... see http://proximityone.com/address2road.htm Viewing Address/Location in Context of Digital Roads  02.04.16. Citizen Voting Age Population by 114th Congressional Districts ... ACS 2014 1-year estimates tabulated by congressional district ... interactive table & GIS/geospatial analysis resources ... see http://proximityone.com/cd114_acs14_cvap.htm % Citizen Voting Age Population by 114th Congressional District  02.02.16. ZIP Code to 114th Congressional District Equivalence Table ... interactive table relating ZIP codes to congressional districts ... individual metros: see http://proximityone.com/zip-cd114.htm 02.01.16. Metro Situation & Outlook Reports Updated ... monthly new authorized residential construction characteristics; December 2015 added ... individual metros: see http://proximityone.com/metro_reports.htm 01.30.16. ACS 2014 Demographic-Economic Interactive Tables ... navigational summary of ACS 2014 1-year & 5-year interactive tables available for wide-ranging types of geography ... see http://proximityone.com/acs2014_tables.htm 01.26.16. State Legislative District Data Analytics ... tools to analyze 2014 session state legislative district demographic-economic characteristics ... interactive table & GIS projects & datasets ... see http://proximityone.com/sld14dp1.htm New York metro house districts & ZIP code $MHI patterns 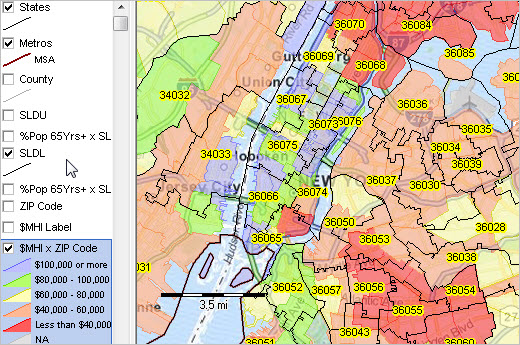 01.22.16. Health Data Analytics ... integrating multi-sourced healthcare related data for market analysis. ... GIS project & data resources ... see http://proximityone.com/hcda.htm Healthcare Infrastructure in Atlanta Area 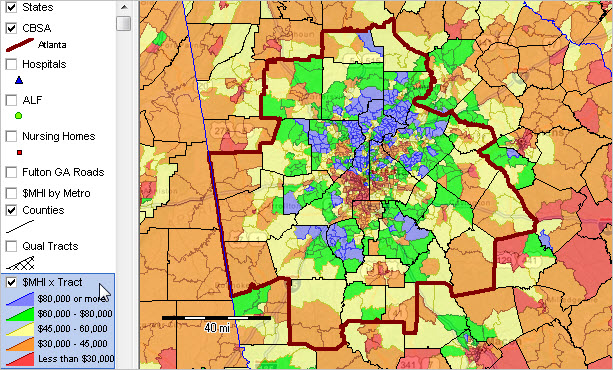 01.19.16. Business Establishment Characteristics by ZIP Code ... establishments, employment & payroll by ZIP code. ... interactive table & GIS resources ... see http://proximityone.com/zbp.htm Establishments by ZIP Code in Los Angeles Area  01.18.16. Data Analytics using R ... mapping statistical data: part 1. ... create & publish your own thematic pattern maps -- no cost ... see http://proximityone.com/data_analytics_withr.htm Population patterns: Texas by county click to view the interactive map 01.13.16. Crime Data Analytics ... integrating location-based crime data with demographic-economic data. ... GIS project & datasets ... see http://proximityone.com/crime_data_analytics.htm Patterns of crime by location & census block; Kansas City, MO  01.09.16. Linguistic Isolation by Block Group ... illustrating use of tools; Los Angeles County applications. ... apply to any county: narrative, GIS project & datasets ... see http://proximityone.com/linguistic_isolation_bg.htm Patterns of Linguistic Isolation; Los Angeles County, CA 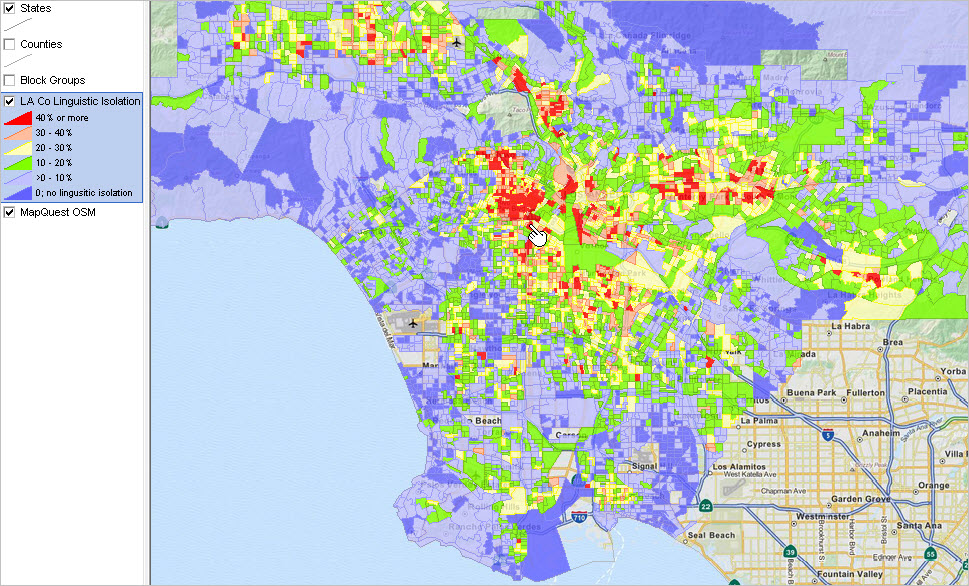 01.05.16. Characteristics of Largest 50 Metropolitan Areas ... narrative, GIS project & datasets ... see http://proximityone.com/largest_50_metros.htm Largest 50 Metros based on population rank  01.02.16. School District ACS 2014 5-year Estimates Interactive Tables ... interactive tables, datasets & GIS projects ... General Demographics ... Social Characteristics ... Economic Characteristics ... Housing Characteristics Percent Population 5-17 Years & Over by School District; South Central U.S. 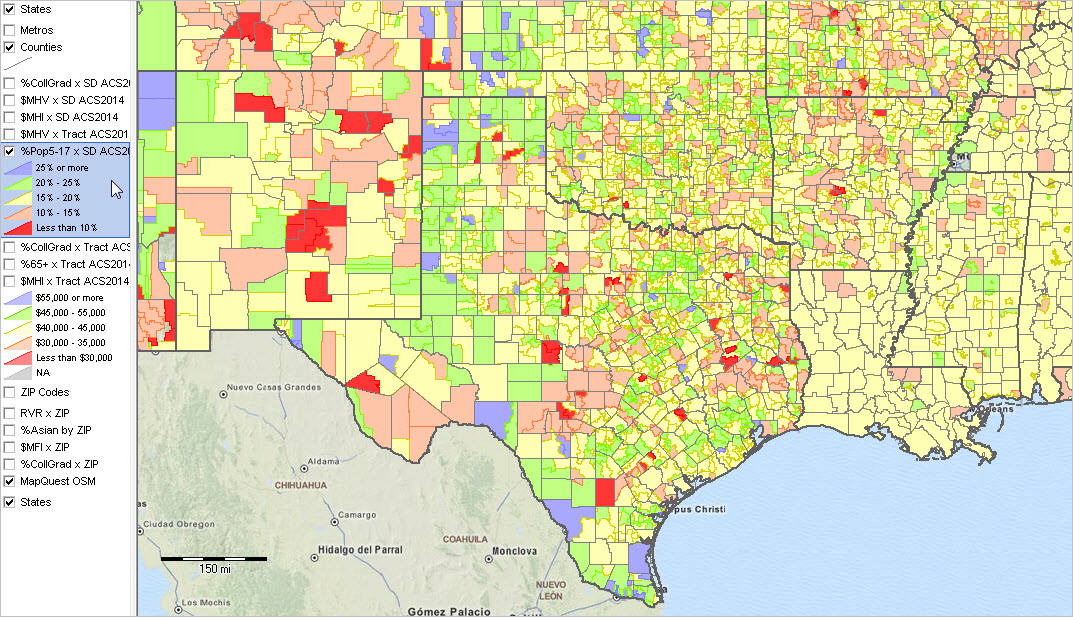 12.30.15. Census Tract ACS 2014 5-year Estimates Interactive Tables ... interactive tables, datasets & GIS projects ... General Demographics ... Social Characteristics ... Economic Characteristics ... Housing Characteristics Percent Population 65 Years & Over by Tract 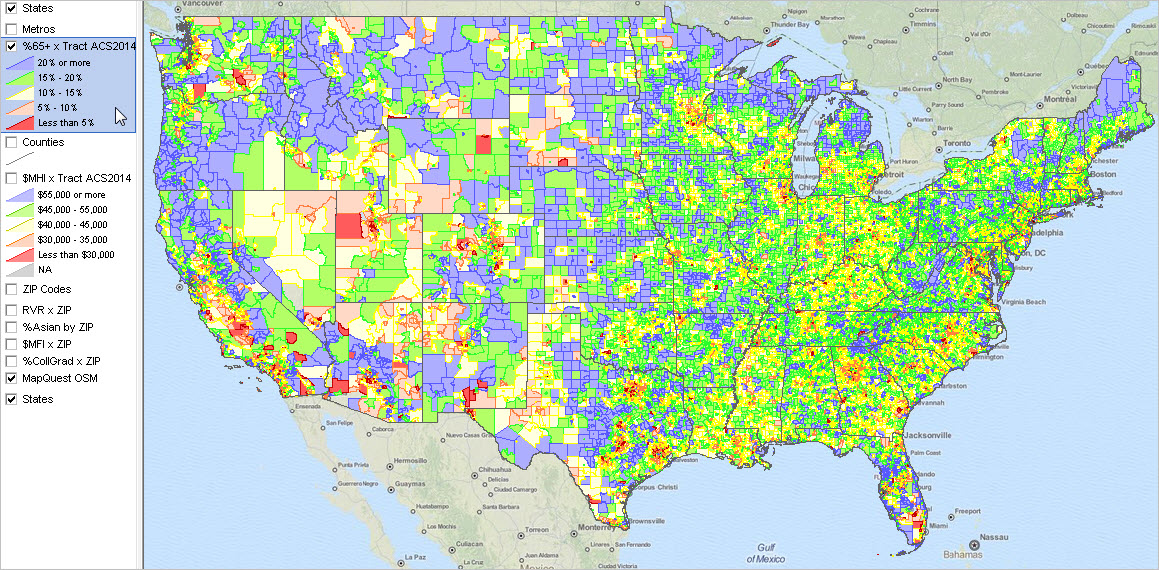 12.26.15. State Population & Personal Income: 2010-2015 ... new 2015 U.S. by state population and personal income estimates; annual series ... interactive table; downloadable GIS resources ... see http://proximityone.com/states2015.htm Patterns of 2015 State PCPI & Population  12.24.15. Mapping Statistical Data ... an array of ready to use GIS projects & datasets for wide-ranging world & US geography ... downloadable GIS resources ... see http://proximityone.com/mapping-statistical-data.htm Patterns of Per Capita Personal Income Change 2008-2014 by County 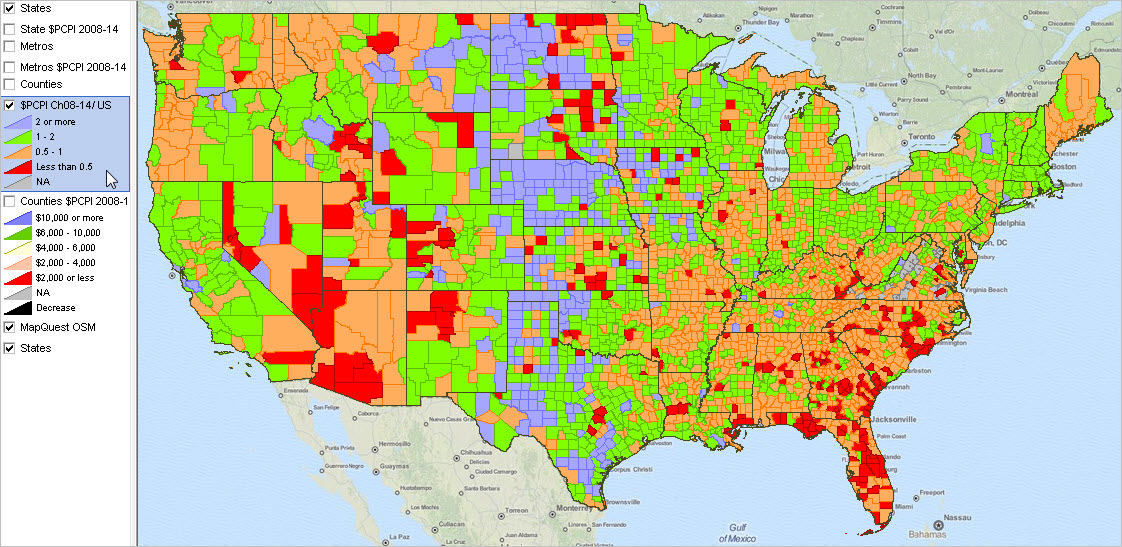 12.21.15. Metropolitan Area Gross Domestic Product ... time series; examining patterns; analytical tools ... interactive table; downloadable GIS resources ... view these data integrated into individual metro reports ... see http://proximityone.com/metrogdp.htm Percent Change in Real GDP by Metro, 2009-2014 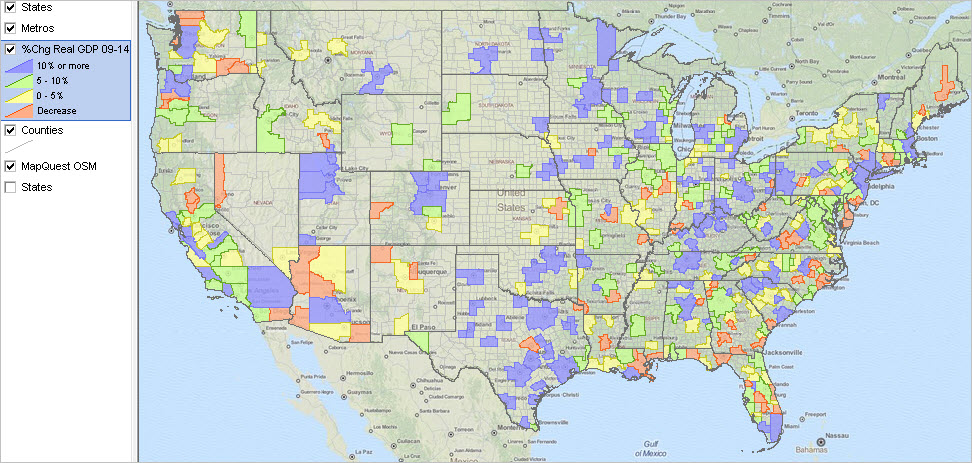 12.14.15. Statistical Release Dates for 2016 ... table showing statistical release dates for 2016 ... builds on OMB Principal Federal Economic Indicators list/calendar ... see http://proximityone.com/staying_ahead.htm#calendar 12.09.15. 2014 ZIP Code Demographic-Economic Interactive Tables ... General Demographics ... Social Characteristics ... Economic Characteristics ... Housing Characteristics rental vacancy rate by ZIP code; Detroit area 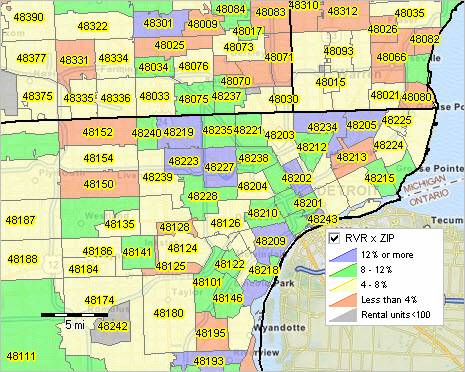 12.07.15. Metropolitan Areas & Fortune 1000 Companies ... counts and lists of Fortune 1000 companies by metro ... See http://proximityone.com/metros_fortune1000.htm Fortune 1000 companies in context of metros 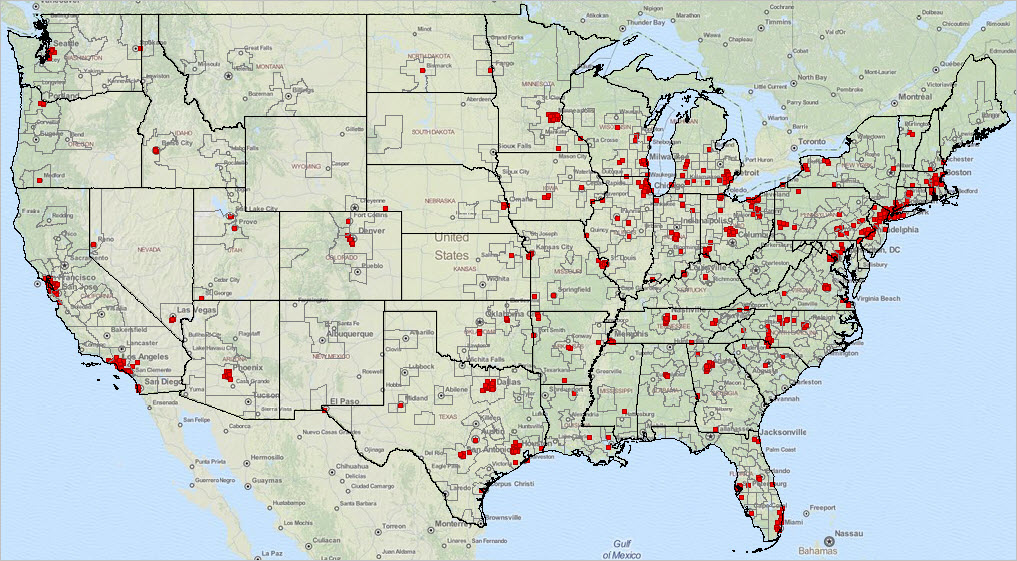 12.04.15. Metropolitan Area Situation & Outlook Reports ... updated with new content and expanded structure ... access a report for any metro. ... See http://proximityone.com/metro_reports.htm 11.30.15. Comparing ACS 2009 & 2014 5-year Estimates ... information on geographic comparability over time ... compare data over time to block group level from two non-overlapping five-year periods ... See http://proximityone.com/acs0914.htm 11.25.15. Housing Units Patterns & Trends: County, Metro, State ... interactive table & GIS tools/applications ... See http://proximityone.com/housing_units.htm Housing Unit Percent Change by County: 2010-2014 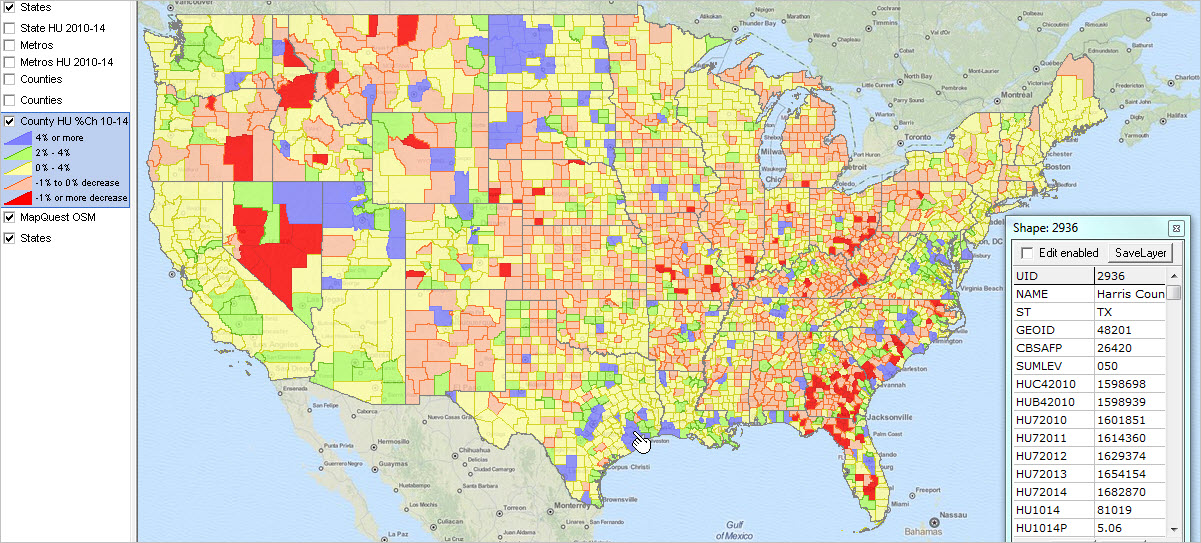 11.23.15. Rental Market Conditions by State & Metro ... interactive table & GIS tools/applications ... See http://proximityone.com/metro_rentalmarket.htm Atlanta/Southeastern U.S. rental vacancy rate by metro  11.20.15. Regional Economic Information System: 2015 Annual Update ... interactive table & GIS tools/applications ... personal income by major source & employment and earnings by industry ... See http://proximityone.com/reis.htm San Francisco Metro/Area 2014 Per Capita Personal Income by County 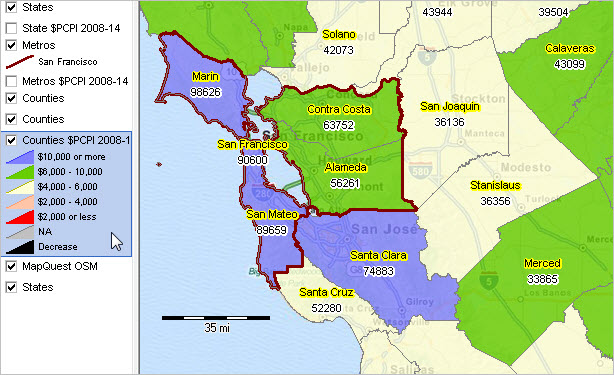 11.19.15. Relating Block Groups to ZIP Code Areas ... interactive table & GIS tools/applications ... population and area for each BG part intersecting with ZIP code area ... See http://proximityone.com/bg-zip.htm San Francisco Block Group 06-075-015700-1 in Context of ZIP 94115 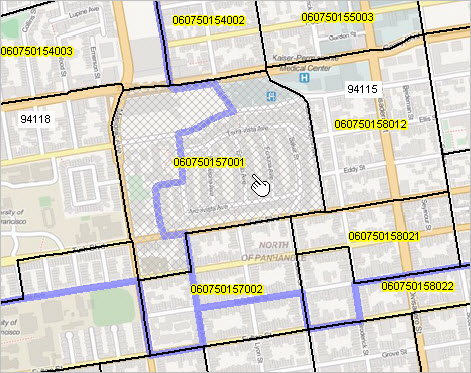 11.16.15. U.S.-State-Metro Demographic-Economic Interactive Analysis ... examining patterns & characteristics of individual/all metros ... 2014 attributes of states & current vintage metros General Demographics | Social Characteristics | Economic Characteristics | Housing Characteristics 11.11.15. Interactive Ranking Tables Section Updated ... geographic-demographic-economic interactive tables ... new features, new tables, scheduling for planned updates ... http://proximityone.com/rankingtables.htm 11.11.15. Navigating the Federal Statistical System ... important U.S. by county level data becoming available November-December ... see overview and dataset summary 11.10.15. Employment-Employment-Earnings by industrial sector ... new 2015Q1 county, metro, state interactive table ... http://proximityone.com/eee.htm 11.07.15. Congressional District Demographic-Economic Interactive Analysis ... examining patterns & characteristics of individual & all districts ... 2014 attributes of 114th Congressional Districts General Demographics | Social Characteristics | Economic Characteristics | Housing Characteristics 11.06.15. Analyzing Competitive Position: Trader Joe's & Whole Foods ... tools, data & methods to help any organization reach goals and objectives ... see http://proximityone.com/bda.htm Trader Joe's & Whole Foods; DC market area analysis  11.05.15. K-12 Data Analytics -- Dallas ISD ... tools, data & methods to analyze schools in context ... apply tools to your districts of interest ... see http://proximityone.com/k12_schools_data_analytics_dallasisd.htm Dallas ISD patterns of poverty by neighborhood; schools; attendance zones; click for larger view  11.02.15 State Median & Mean Household & Family Income 2012-2014 ... examining patterns of well-being ... interactive table, data profiles & GIS applications ... http://proximityone.com/state_income.htm 10.20.15. Mapping ZIP Code Demographics ... tools and data resources for analyzing ZIP Code area patterns ... interactive table & GIS applications ... http://proximityone.com/mapping_zipcode_demographics.htm 10.09.15. Housing Price Index Patterns by Metro/State; Quarterly Update ... interactive table: view/rank/compare metros/states 2014Q2-2015Q2 ... GIS project/datasets ... see http://proximityone.com/hpi.htm 10.08.15. 114th Congress Members: Political-Demographic-Economic Characteristics ... interactive table: incumbent location, hard line Republicans, other ... see http://proximityone.com/cd114_members.htm 10.05.15. 114th Congressional Districts: Household Income & Household Value: 2013-2014 ... patterns of change; interactive table; examine peer group ... see http://proximityone.com/cd114_2013_2014.htm 09.26.15. Business Data Analytics ... tools, data & methods to reach goals and objectives ... see http://proximityone.com/bda.htm 09.18.15. Metro Housing Value & Household Income: 2013-2014 ... patterns of change; interactive table; examine peer group ... see http://proximityone.com/metros_2013_2014.htm 09.17.15. American Community Survey 2014 1-Year Estimates Released ... annually updated ACS 1-year estimates now available ... see http://proximityone.com/acs2014.htm 09.06.15. Atlanta Metro Demographic Outlook: 2015 to 2040 ... current estimates and projections to 2040; available for all counties/metros ... see http://proximityone.com/outlook2040_atlanta.htm 08.30.15. Charter Schools 2013-14: Characteristics & Patterns ... characteristics of individual charter schools; interactive table ... see http://proximityone.com/sch1314_charter.htm 08.24.15. Largest 800 School Districts & Detailed Demographic-Economic Profiles ... patterns of change; interactive table; examine peer group ... see http://proximityone.com/lgsd_acs.htm 08.16.15. MapCompiler: Building GIS Projects ... illustrates use of CV XE GIS GeoGateway feature to develop custom maps ... see http://proximityone.com/cvxe_mapcompiler.htm 08.13.15. Location-Based Demographic-Economic Characteristics ... interactive API-based data access & display tool ... see http://proximityone.com/location_based_demographics.htm 08.11.15. Mapping Circular Area Demographic-Economic Characteristics ... tools to develop sit analysis profiles using census blocks & census block demographics ... see http://proximityone.com/cv_caps.htm 08.09.15. County Age Cohort Trend Analytics ... tools to map/analyze 5 year age-cohort data annually 2010 through 2014 ... downloadable GIS Project ... see http://proximityone.com/countytrends_agegroups.htm 08.04.15. 1790 Census: 225 Years Ago ... see Data Analytics Blog 07.25.15. 2015 Metropolitan Statistical Area Designation Updates ... one new MSA; sixteen new MISAs, 5 new CSAs ... see http://proximityone.com/metros2015_updates.htm 07.21.15. Navigating the U.S. Federal Statistical System ... guide to primary Federal statistical programs and data resources ... see http://proximityone.com/fss.htm 07.15.15. Data Analytics Labs ... providing access to tools and data resources for planning and analysis ... see http://proximityone.com/dal.htm 05.30.15. Mapping Block Group Data ... tools and methods to visually analyze demographic-economic patterns by block group ... see Mapping Block Group Data 05.22.15. City/Place Population Trends; Annual Updates ... annual population updates for all cities; 2010-2014 ... interactive table & GIS/mapping resources ... see City/Place Annual Updates 05.15.15. Analyzing County Health Patterns ... data resources & GIS applications ... see County Health Patterns 05.05.15. County Population Trends; Annual Updates ... annual population updates for all counties; 2010-2014 ... interactive table & GIS/mapping resources ... see County Population Annual Updates 04.19.15. K-12 Schools & School District Data Analytics ... illustrative Data Analytics that can be used for any school district ... resources and methods for strategic planning; improving educational opportunities & outcomes ... see K-12 Data Analytics 03.27.15. Data Analytics & API Tools ... review of API tools to access, integrate & use geographic, demographic, economic data ... benefits & examples of using API tools in Data Analytics ... http://proximityone.com/api_tools.htm 03.23.15. Creating & Using Address Shapefiles ... CV XE GIS Find Address feature now available in all versions ... key in address(s), show on map, create & save shapefile ... http://proximityone.com/address_shapefiles.htm 03.14.15. 114th Congressional District Gallery ... thematic maps each/all 114th Congressional Districts ... patterns of neighborhood prosperity in context of congressional district ... http://proximityone.com/cdgallery/guide/index.htm ... Illinois/Chicago CD 114 #01 ... ... 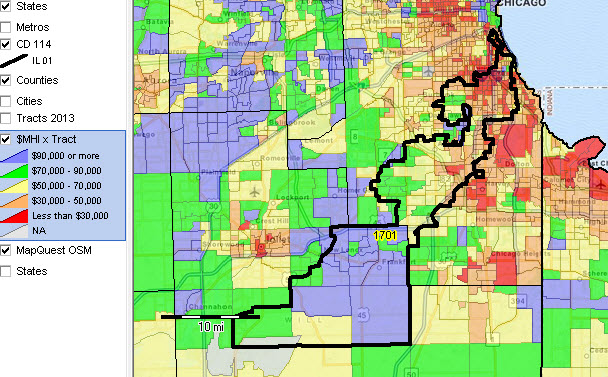 03.13.15. Single Year of Age Demographics ... tools to examine population by single year of age x gender x race/origin ... http://proximityone.com/syoa.htm ... Atlanta population age 0 per 1,000 population by ZIP Code ... ... 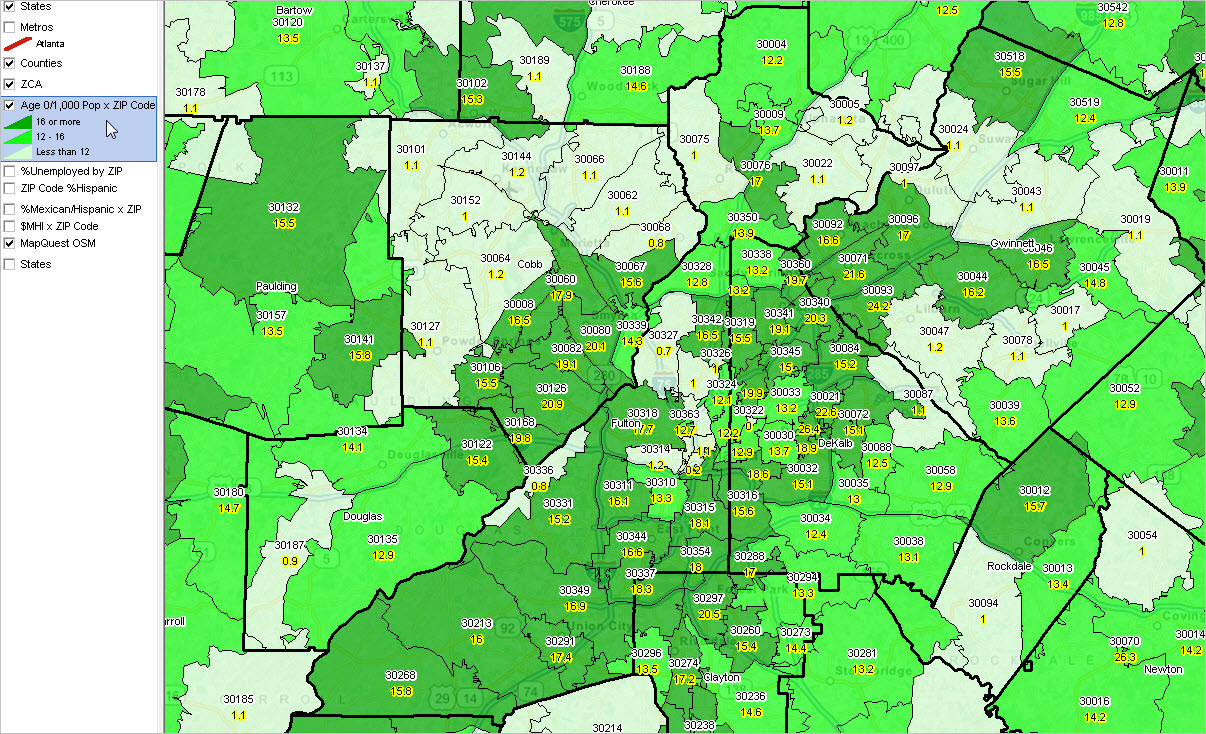 03.04.15. Hispanic Population by Specific Origin by ZIP Code ... interactive table & GIS resources to examine Hispanic population by specific origin by ZIP code ... http://proximityone.com/hispanic_origin_zip.htm ... Mexican as percent of Hispanic population by ZIP Code ... Harris County, TX ... ... 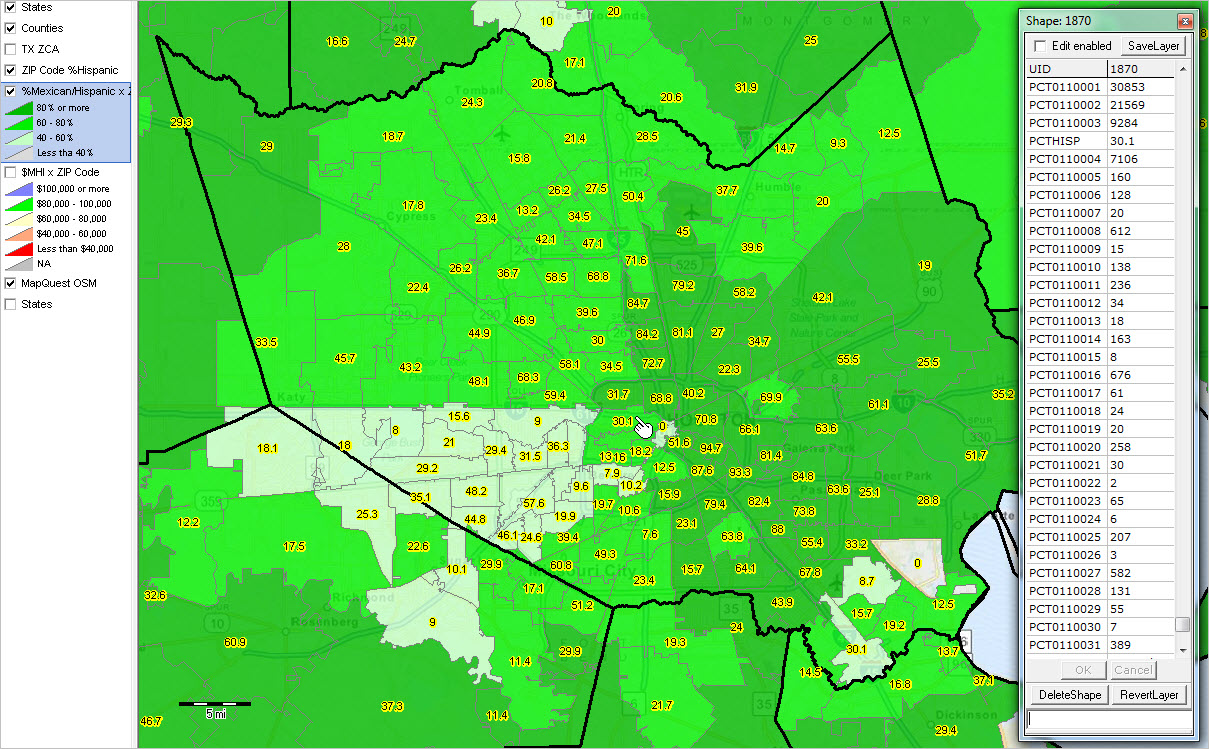 03.03.15. Local Area Labor Force Characteristics ... guide to accessing & using selected local area labor force characteristics data ... http://proximityone.com/laep.htm ... employment by ZIP Code ... Harris County, TX ... ... 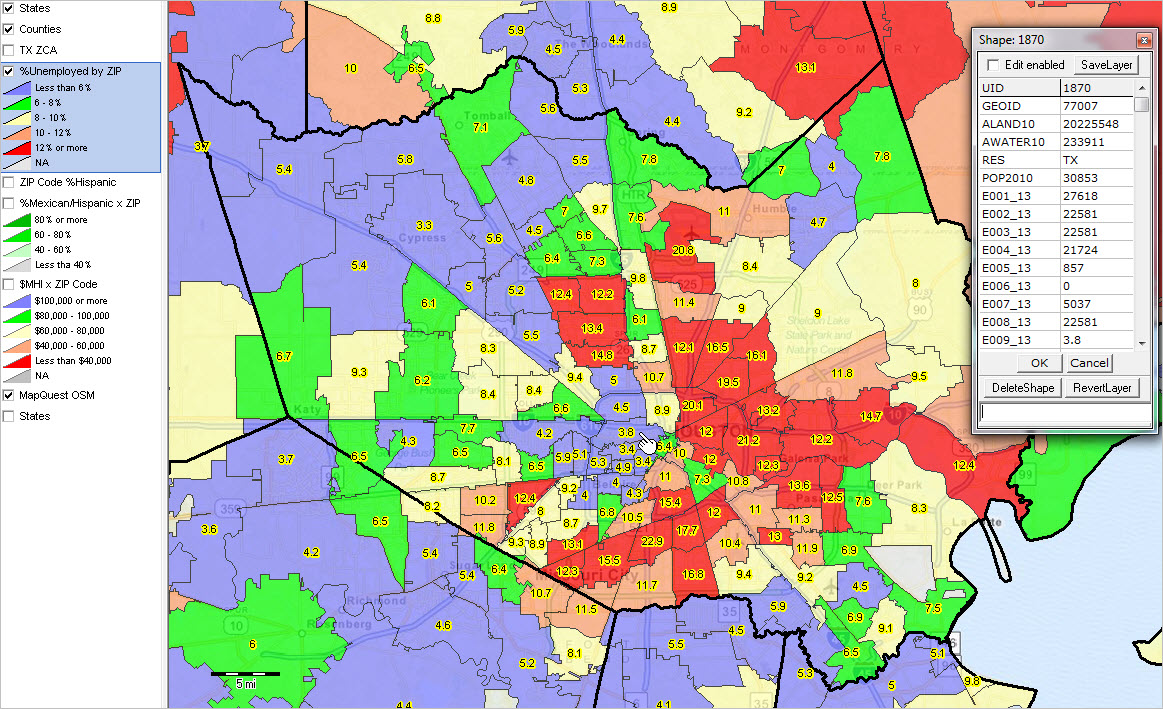 02.27.15. Guide to ZIP Code Data Resources ... options to access and use ZIP Code area geographic, demographic and economic data ... http://proximityone.com/zipdata_resources.htm ... Harris County, TX area ZIP code areas ... ...  02.23.15. Evolution of Census Tracts: 1970-2010 ... tools & data resources to examine statistical area geographic change ... http://proximityone.com/tracts_evolution.htm ... one tract in 1970 becomes 44 tracts by 2010 ... Collin County, TX ... ... 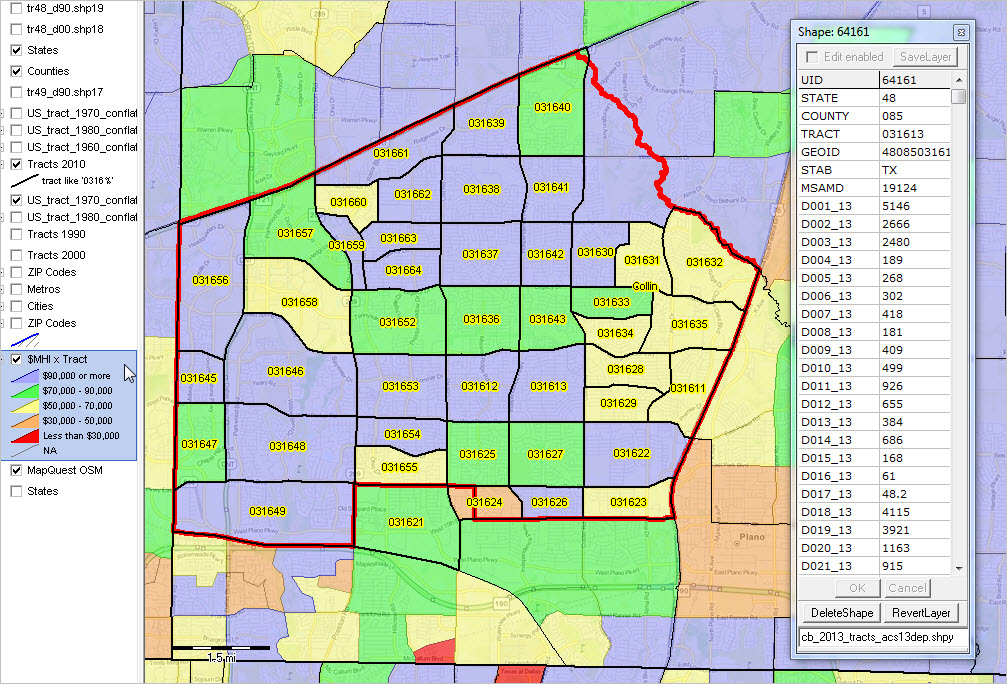 02.19.15. Analyzing Census Tract Demographics by ZIP Code ... tools & data resources to analyze census tract demographics by ZIP code ... http://proximityone.com/tractzip.htm ... visualizing patterns ... Chicago area ... ... 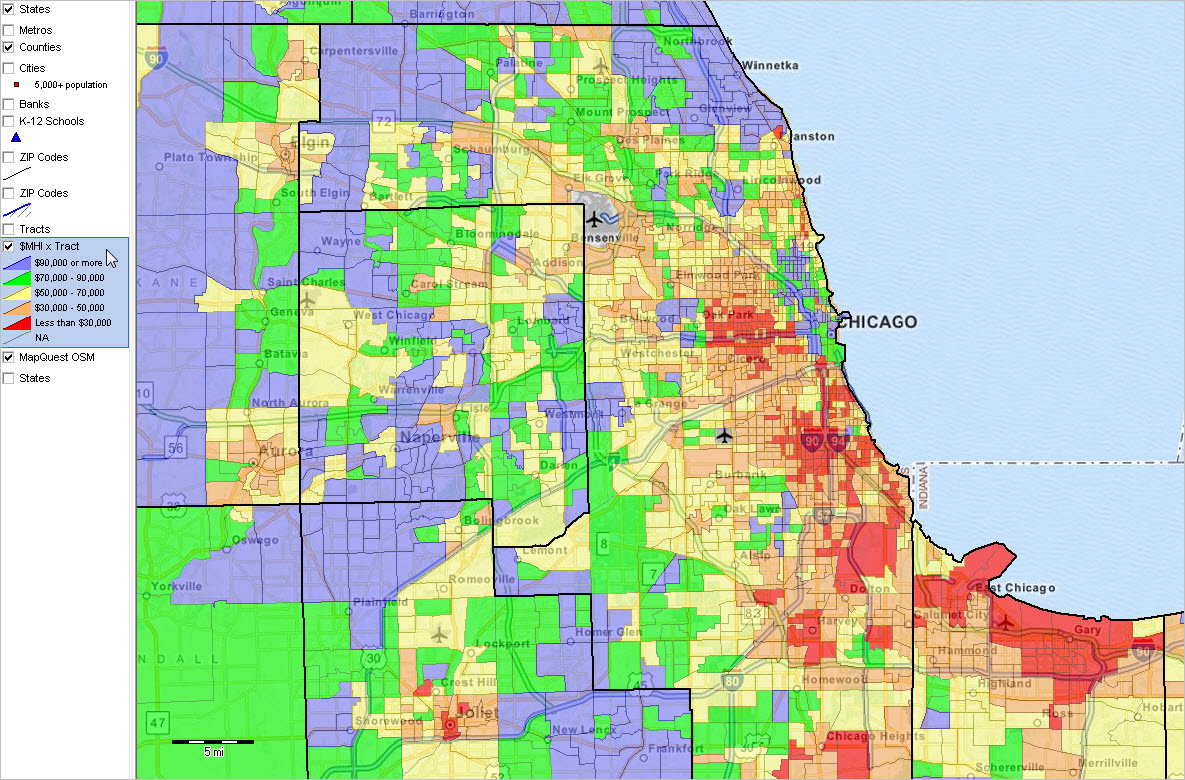 02.17.15. Financial Institutions & Neighborhood Characteristics ... examining relationships with GIS tools: FDIC-insured banks and savings institution locations and census tract demographic-economic characteristics ... http://proximityone.com/fim1.htm ... visualizing patterns ... Houston area ... ... 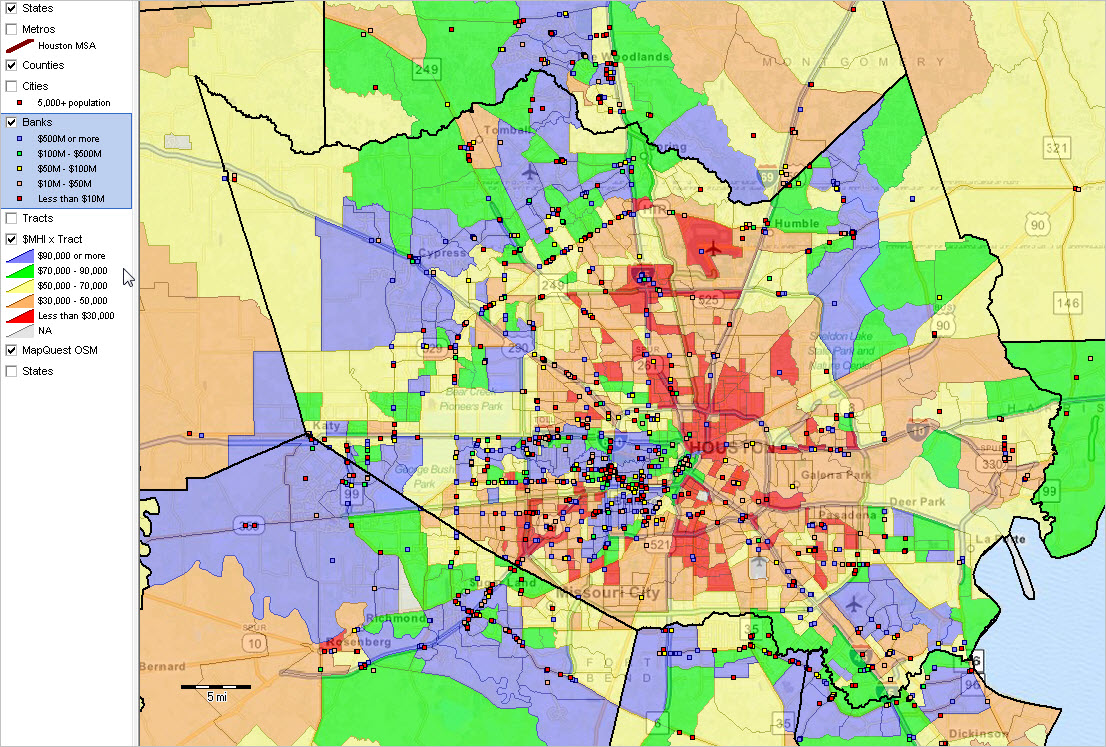 02.14.15. New Voting Rights Act Demographics ... ACS 2009-13 Citizen Voting Age Population (CVAP) estimates by race/origin ... examining relationships between legislative districts, census tracts, voting districts & census blocks ... interactive table -- http://proximityone.com/cvap_tracts_2013.htm ... visualizing patterns ... Los Angeles area ... ... 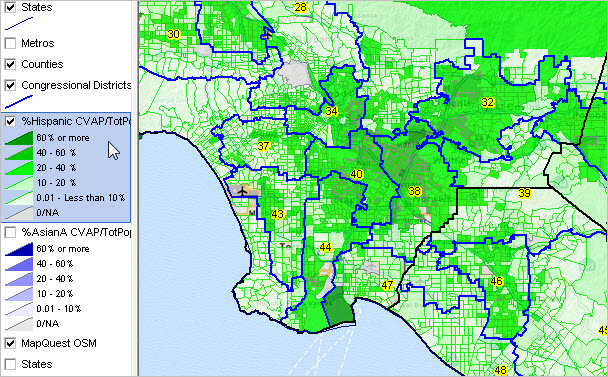 02.03.15. Making Maps of the World Using GIS Resources - data and tools to examine geographic-demographic-economic patterns of the world - see http://proximityone.com/world2015.htm - Paris Starbucks locations; click for larger view  01.29.15. Patterns of Block Group Income Inequality - data and tools to examine patterns of income equality by block group - see http://proximityone.com/blockgroup_income_inequality.htm - patterns of income inequality by block group; New York city; click for larger view  01.27.15. Tracking Language Use and the Decennial Census - tracking language use in New York Times stories relating to the decennial census over time - http://proximityone.com/tracking_language_use.htm - stories relating to decennial census, 1960-2010; click for larger view  01.26.15. Daytime Population: U.S. by State & County - annual update based on ACS 2013 - interactive table; GIS project: http://proximityone.com/daytime_population2013.htm - Atlanta metro area by county: patterns of employment-residence ratio:  01.20.15. New York 2015 Schools & School Districts GIS Project - annual update to New York statewide schools & school districts GIS project - see more about NY 2015 K-12 GIS Project - zoom-in to Pelham CSD showing schools & patterns of economic prosperity & educational attainment:  01.19.15. State Patterns of Income & Income Inequality - 2012. 2013 median household income & Gini Index -- dataset, interactive table, GIS project - http://proximityone.com/state_mhi2013.htm - visual analysis of the Gini Index; measure of income inequality:  01.14.15. All K-12 Public Schools Enrollment & Infrastructure 2012-13 Update - 2012-13 K-12 public schools interactive table - interactive table: http://proximityone.com/k12publicschools.htm - see in GIS applications 01.13.15. All LEA/School Districts Enrollment & Infrastructure 2012-13 Update - 2012-13 Local Education Agency/school districts interactive table - interactive table: http://proximityone.com/sddmi.htm - see in GIS applications 01.08.15. Arizona K-12 Schools & School Districts GIS project - examining schools/school districts and neighborhood characteristics - downloadable GIS project & related datasets - 2012-13 school/school districts & attributes - state by census tract integrated ACS 2013 demographic-economic data - see http://proximityone.com/k12_az.htm Patterns of economic prosperity; Mesa Unified in context of Mesa city:  01.06.15. New 2012-13 School & School District Enrollment & Infrastructure Characteristics - Arizona schools/school districts GIS project; downloadable datasets - http://proximityone.com/k12_az.htm  01.05.15. New Residential Construction by Metro - Monthly time series; downloadable dataset, interactive table, GIS Project - http://proximityone.com/metro_residentialconstruction.htm 12.26.14. State Population & Components of Change Estimates 2010-2014 - new 2014 estimates; accessing & using estimates & trends data -- dataset, interactive table, GIS project - http://proximityone.com/state_pop2014.htm  12.24.14. State-to-State Geographic Mobility: Migration Flows in 2013 - examining state-to-state migration -- dataset, interactive table, GIS project - http://proximityone.com/state_migration2013.htm  12.17.14. Children in Poverty by School District - 2013 estimates of children in poverty by school district; all U.S. interactive table & GIS resources. - see http://proximityone.com/cip_sd_2013.htm  12.12.14. ZIP Code Patterns of Economic Prosperity - view, query, rank, compare ZIP codes based on income, housing value and other items. - interactive table http://proximityone.com/acs0913_zips.htm 12.10.14. Metro Profiles Updated - click link in table to view a metro profile: http://proximityone.com/metros2013.htm - examples: Houston ... Charlotte ... Chicago 12.04.14. American Community Survey 2013 5-year Estimates - 2009-13 demographic-economic estimates for all areas. - access via http://proximityone.com/dede.htm - more about these data http://proximityone.com/acs0913.htm 11.21.14. Regional Economic Information System Updates - 2014 annual update: http://proximityone.com/reis.htm 11.18.14. Metros 2014: Chicago-Naperville-Elgin, IL-IN-WI MSA - summary of resources to examine demographic-economic patterns - more information: http://proximityone.com/metros_chicago.htm  11.13.14. Census 2010 PUMS Files Released - Census 2010 Public Use Microdata Sample Files - more information: http://proximityone.com/cen2010_pums.htm 11.06.14. Hawaii 2014 GIS Resources - 2014 Census-centric GIS project fileset - more information: http://proximityone.com/hawaii2014.htm  11.03.14. Nursing Homes 2014 - analyzing characteristics of 2014 nursing homes - more information: http://proximityone.com/nh.htm  10.29.14. K-12 Private Schools Update - GIS resources & interactive table - overview & links: http://proximityone.com/k12privateschools.htm  10.22.14. USA TODAY Analyzes County Diversity to 2060 using ProximityOne Projections - a century of diversity patterns; 1960-2060 - overview & links: http://proximityone.com/county_diversity_1960_2060.htm  10.16.14. 2013 Demographic-Economic Characteristics for 2013 Metros - first time: detailed 2013 subject matter for 2013 vintage metros - interactive table & GIS: http://proximityone.com/acs2013_metros.htm  10.10.14. ZIP Code Urban/Rural Demographics Patterns - total, urban, rural population & housing; geographic area; population density - interactive table: http://proximityone.com/zip_urban_rural.htm  10.08.14. K-12 School Urban/Rural Status based on Census Block - assigning Census 2010 census block code & urban area code to each K-12 school - all schools interactive table: http://proximityone.com/sch1213ua.htm  10.02.14. Mapping Urban/Rural Patterns by Census Block - using TIGER 2014 and Census 2010 demographics & GIS applications - see http://proximityone.com/mapping_census_blocks.htm  09.26.14. State of the States 2013 - state by state demographic characteristics - interactive table -- http://proximityone.com/states2013.htm  09.18.14. Easy Access to ACS 2013 1 Year Estimates - all areas/all types of areas for which 1-year data tabulated - API-based subject matter access - see interactive table -- http://proximityone.com/acs2013.htm#table 09.15.14. Households by Computer Use & Internet Access -- by Metro - Among the largest metros in 2013, metro total households having broadband Internet access ranged from 29.5% (Gallup, NM MISA) to 86.0% (San Jose-Sunnyvale-Santa Clara, CA MSA). - Interactive table & details: http://proximityone.com/computer_use.htm 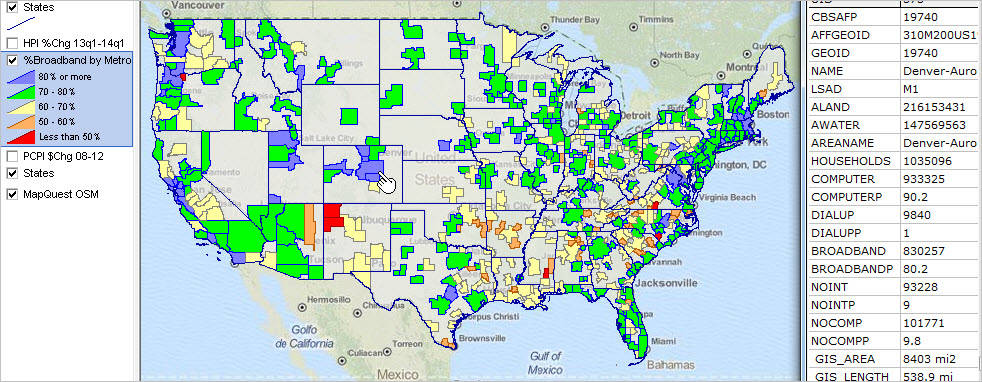 09.10.14. Shp2XML -- Extracting Shapefile Geometry - no fee tool to convert shapefile geometry to XML/XLS - create polyline files; display shapefile geometry on Google/Bing maps - see http://proximityone.com/shp2xml.htm 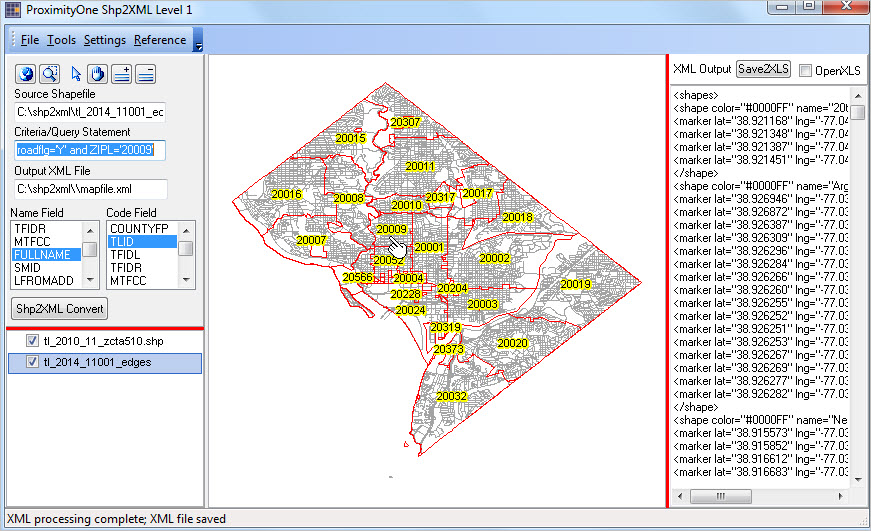 09.05.14. Examining Neighborhood Diversity Patterns - examine your area; no fee GIS tools and resources - see http://proximityone.com/neighborhood_diversity.htm 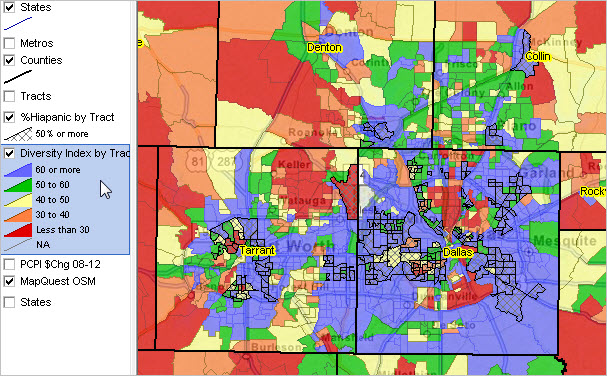 08.20.14. New 2013-14 School District Boundary Files - new 2013-14 school district boundary files show updated boundaries - see http://proximityone.com/schooldistricts_2013-14.htm - Houston ISD, TX 2013-14 boundary (red) compared to 2011-12 boundary (black) 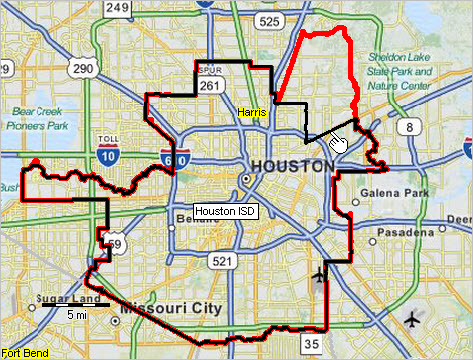 08.08.14. Personal Consumption Expenditures by State, 1997-2012 - http://proximityone.com/pce.htm - interactive table: view/rank/compare states by PCE category - downloadable GIS project and related analytical - see how is PCE by household changing ...  07.30.14. Finding the Right Data - http://proximityone.com/finding_your_data.htm - review of methods & resources to locate specific subject matter - tools you can use for query & search 07.26.14. Making Custom Congressional District Maps - http://proximityone.com/cd113_maps.htm - download & use GIS resources; make custom congressional district maps - examine urban/rural patterns by congressional district - TX CD 22 by county & urban/rural patterns ... 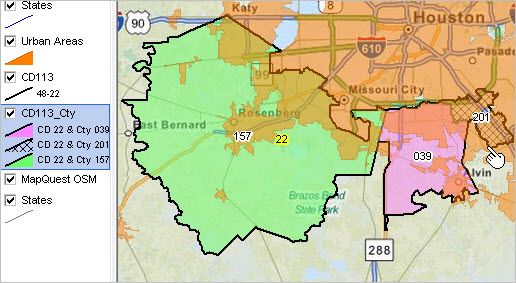 07.23.14. Measuring the U.S. Economy: Industry Analysis - http://proximityone.com/industry_analysis.htm - examining detailed industry attributes - using industry data from 2012 Economic Census ... integrating and using with related industry data 07.16.14. Healthcare Demographic Economic Analytics - http://proximityone.com/healthcare_analytics.htm - using GIS resources for healthcare market analysis - Medically Underserved Areas & neighborhoods by economic prosperity ... 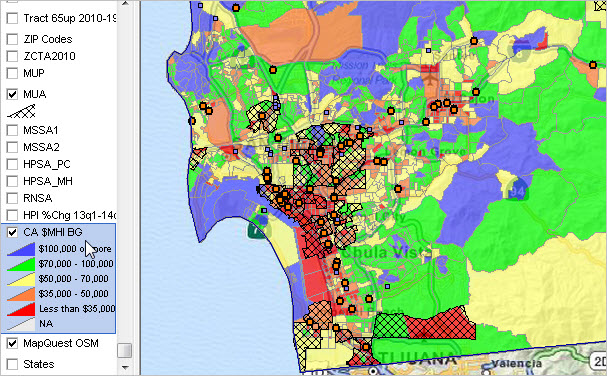 07.09.14. School District Urban, Suburban, Rural Classification & Patterns - mapping/viewing patterns: school districts by urban-rural locale code - download GIS resources for further analysis - markers show urban school districts based on a locale code ... 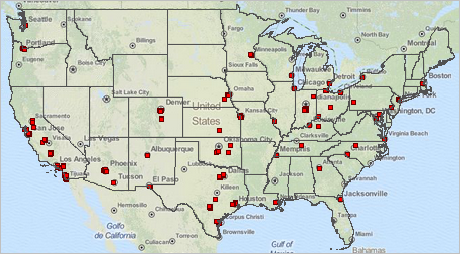 07.03.14. Making Custom Metropolitan Area Maps - use these no fee GIS resources - make custom metropolitan area maps: any metro ... all metros - create views adding your own data; other geography 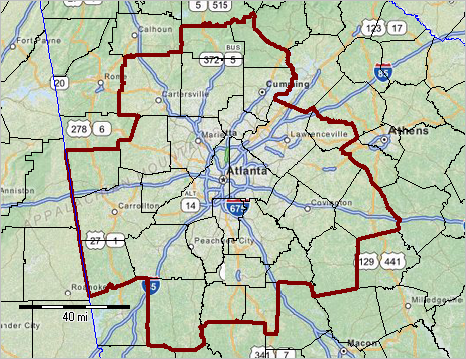 07.01.14. Future of India: Trends & Age-Cohort Analysis - examining the future of India - analyzing population trends to 2050 by gender and age - no fee tools you can use to examine patterns 06.20.14. Demographic Economic Data Extraction - Demographic Economic Data Extraction (DEDE) API tool - extract multi-sourced demographic economic data - census block, block group and other geography 06.02.14. National/State/Metro Quarterly Housing Price Index Updates - component of ProximityOne Situation & Outlook Database - data for 2014Q1 and quarterly trends - interactive ranking table -- http://proximityone.com/hpi.htm  06.01.14. Children's Demographics by School District - examine children's demographic economic characteristics by school district. - more at Children's Demographics - map view: school district patterns by congressional district  05.23.14 -- City and SubCounty Population Estimates; 2014 Update - access & analytical tools: http://proximityone.com/places2013.htm - interactive table & GIS project; example focused on Phoenix metro ...  05.16.14. Rental Market Conditions by State & Metropolitan Area; 2014 Update ... http://proximityone.com/metro_rentalmarket_2014.htm ... U.S., states and metros -- interactive housing market characteristics table  05.05.14. -- County Population Estimates & Components of Change - trend analysis; detailed profiles for each county and state - interactive table -- http://proximityone.com/ctypop1.htm 04.28.14. -- Real Personal Income for States & Metros - component of ProximityOne Situation & Outlook Database - interactive ranking table -- http://proximityone.com/metro_rppi.htm  04.24.14. -- 100 Largest School Districts, 2014 Update - interactive ranking table -- http://proximityone.com/lgsd.htm  04.17.14. Native American Area GeoDemographics ... http://proximityone.com/nativeamericanareas.htm ... national scope Native American areas interactive demographics table  04.06.14. Outlook 2020: Annual County Projections by Age ... http://proximityone.com/outlook2020.htm ... county annual population projection by age  04.03.14. ChartGraphics Population Pyramids ... http://proximityone.com/chartgraphics.htm ... visual analysis of age-cohort patterns ... ready-to-use U.S. by county, school districts; world by country ... China, Total Population, 2050  03.28.14. New Metro & County Population Estimates & Components of Change ... http://proximityone.com/metro_county_2013.htm ... latest official annual data 2010 forward; interactive table -- view/query/rank/compare ... ready-to-use GIS resources -- click graphic for larger view & details  03.24.14. APIGeocoder ... batch or interactively geocode your address data; no fee tool ... http://proximityone.com/apigeocoder.htm 03.13.14. America's Communities Program ... individual community integrated decision-making information ... http://proximityone.com/acp.htm  03.05.14. Geographic Information Systems & Decision-Making ... what is GIS & how does it work? ... http://proximityone.com/aboutgis.pdf  03.03.14. Neighborhood Patterns GIS Projects ... state by neighborhood GIS projects; no fee usergroup resources ... ready-to-use projects to analyze neighborhood demographic-economic patterns ... http://proximityone.com/neighborhood_patterns.htm  02.24.14. APIGateway Integrated Data Profile Updated ... create, view, analyze multi-sourced demographic-economic data ... organized profile with monthly, quarterly, annual data updates ... http://proximityone.com/cv_apigateway.htm 02.18.14. 113th Congressional Districts Demographic-Economic Interactive Tables - annual update ... view, rank, compare state-congressional districts of interest - General Demographics - Social Characteristics - Economic Characteristics - Housing Characteristics 
02.15.14. U.S.-States-Metro-County Demographic-Economic Interactive Tables - annual update ... view, rank, compare state-metros-counties of interest - General Demographics - Social Characteristics - Economic Characteristics - Housing Characteristics 
02.14.14. Principal Cities of Metros ... view, rank, compare principal cities of interest - http://proximityone.com/principalcities.htm; using GIS & interactive table to examine principal cities - Atlanta, GA MSA Principal Cities ... 
02.13.14. City/Places Demographic-Economic Interactive Tables - annual update ... view, rank, compare school districts of interest - General Demographics - Social Characteristics - Economic Characteristics - Housing Characteristics 
02.10.14. Hispanic Population by Specific Origin by Census Tract & County ... 28 categories of specific origin; GIS and geospatial analysis resources ... interactive table: http://proximityone.com/hso.htm ... Percent Population Mexican Origin -- Los Angeles Area by Tract 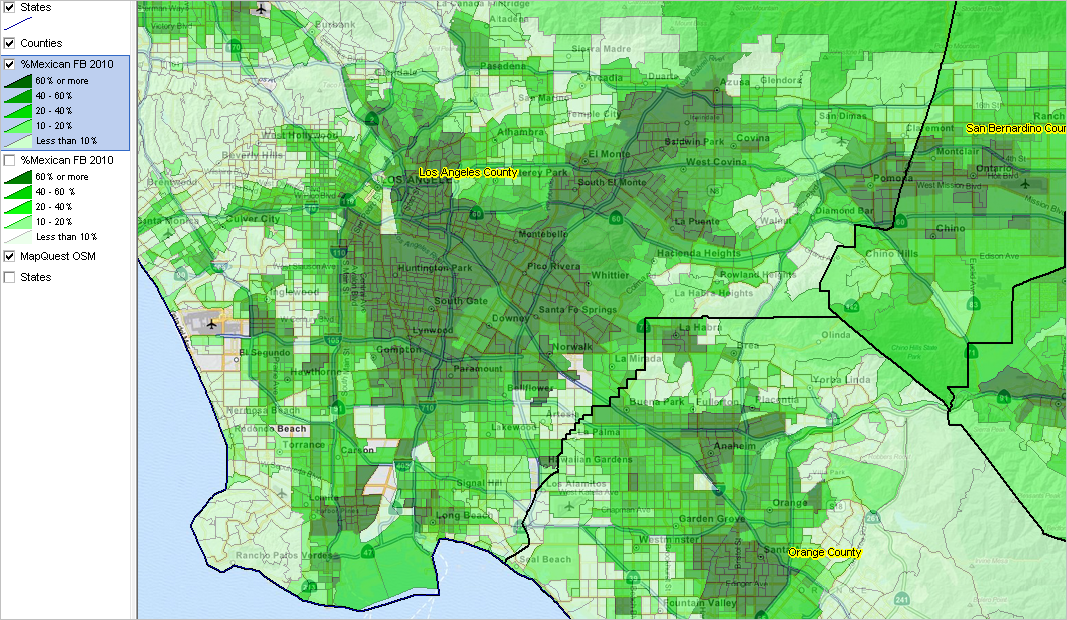
02.07.14. School District Comparative Analysis Profiles ... view comparative analysis report/profile for school districts of interest ... side-by-side comparison of one district with other districts, states, U.S. ... see reports: http://proximityone.com/sddep.htm  02.03.14. Naturally Occurring Retirement Communities ... 10,000+ areas where more than 40% have head of household age 65 years or over ... http://proximityone.com/norc.htm 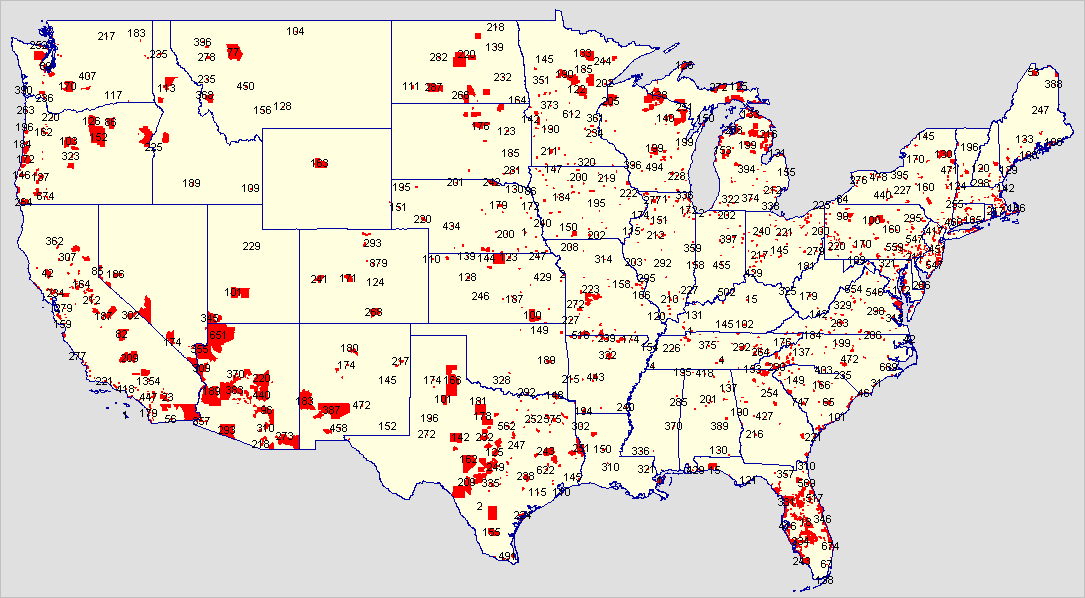 01.31.14. School District Demographic-Economic Interactive Tables - annual update ... view, rank, compare school districts of interest - General Demographics - Social Characteristics - Economic Characteristics - Housing Characteristics 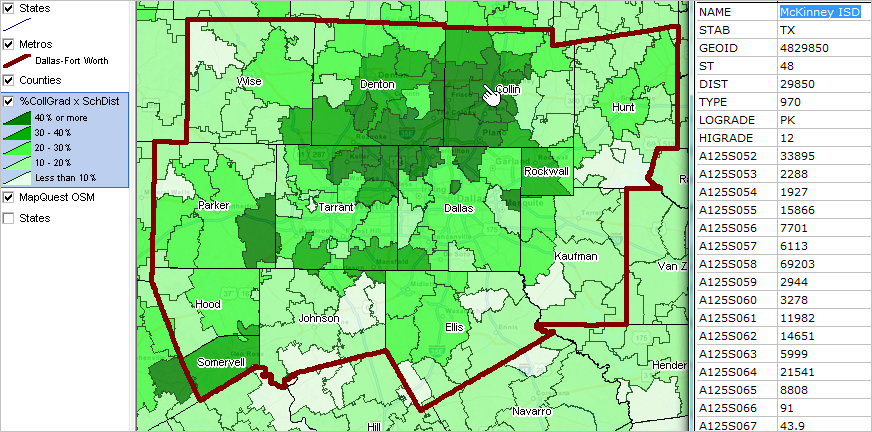 01.23.14. Demographic-Economic Comparative Analysis - develop/use demographic-economic comparative analysis profiles & spreadsheets - side-by-side comparative analysis for user selected geography - see http://proximityone.com/usstcbsa_dp.htm 01.22.14. State & Metro Demographic-Economic Interactive Tables - General Demographics - Social Characteristics - Economic Characteristics - Housing Characteristics 01.20.14. State Personal Income Patterns - quarterly updates through 2013Q3 - interactive table: http://proximityone.com/state_personalincome.htm 01.18.14. Road Corridor Demographics - develop/use road shapefiles with right- & left-side attributes - link Census/ACS data; attach geocoded data to roads for geospatial analysis - see http://proximityone.com/dmd_roadcorridors.htm 01.13.14. State Legislative District GeoDemographics - comparing 2010 & 2012/current vintage districts - see more about state legislative district GIS/mapping/geospatial analysis - create your own custom state legislative district maps 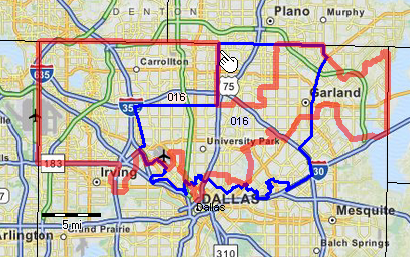 01.06.14. Mapping Poverty in America - mapping poverty by census tract & school district - see about http://proximityone.com/mapping_poverty.htm & GIS/mapping/geospatial analysis - create your own custom map views  01.02.14. K-12 Public Schools & Enrollment Characteristics Interactive Ranking Tables - 104,000+ schools; new data based on school/school district reported data - see about school comparative analysis profiles & GIS/mapping/geospatial analysis - use interactive table: http://proximityone.com/k12publicschools.htm  12.30.13. Census Tract Demographic-Economic Interactive Ranking Tables - 73,056 tracts; new ACS 2012 5-year estimates - see interactive tables: http://proximityone.com/tracts12dp1.htm 12.20.13. Small Area Disability Demographics - new data & tools to analyze census tract & higher level disability patterns - Small Area Disability Demographics 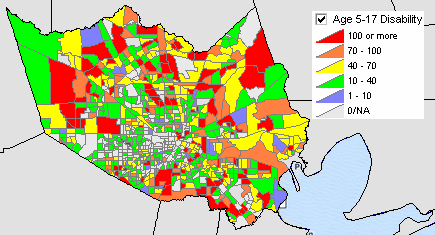 12.19.13 -- Employment Projections to 2022 - new 12/19/13; detailed occupation by industry - access via http://proximityone.com/employment_projections.htm 12.18.13 -- National/State/Metro/County Quarterly Establishments-Employment-Earnings - component of ProximityOne Situation & Outlook Database - 2013Q2 released; available for all metros in interactive ranking table - access via http://proximityone.com/cv_apigateway.htm 12.17.13 -- American Community Survey 2012 5-year Estimates - 2012 demographics-economic estimates - national scope data for all tabulation areas (includes block groups) - updates to corresponding 2011 estimates released September 2012. - see http://proximityone.com/acs2012.htm 12.17.13 -- American Community Survey 2012 1-year PUMS Files - 1-year Public Use Microdata Sample (PUMS) files - see http://proximityone.com/acs2012pums.htm 12.16.13. State Population Projections to 2030 - annual estimates & projections & change - interactive table: http://proximityone.com/outlook2030_states.htm 12.15.13. Linguistic Isolation by Block Group - data & tools to examine households & linguistic isolation measures - Linguistic Isolation Patterns 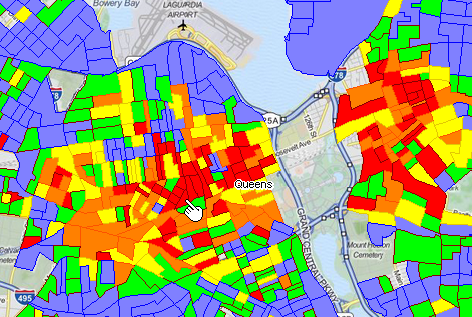 12.13.13. School District 2012 Demographic Estimates - all school districts; total population, children in poverty by school district - interactive table: http://proximityone.com/sdpop12.htm 12.12.13. ACS 2012 5-year Demographic-Economic Data Access Pre-Release Details - new web section; interactive table: query/rank/compare subject matter coverage - data access & use options: http://proximityone.com/acs0812.htm 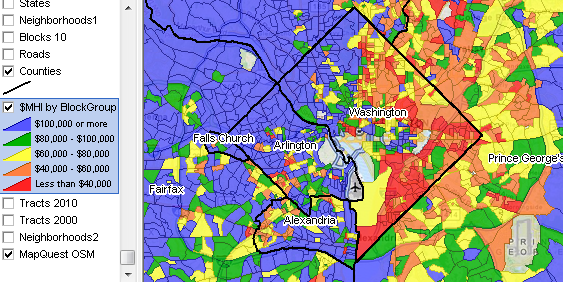 12.11.13. County Monthly Workforce Patterns - examine monthly and annual employment & unemployment by county - interactive table: query/rank/compare counties: http://proximityone.com/county_workforce.htm - use downloadable national scope GIS project to develop pattern views:  12.06.13. School Attendance Zone Boundary Files & Demographic Analysis - using school attendance zone shapefiles & demographics ... http://proximityone.com/saz.htm. - DMI Blog on school attendance zone analysis. - Join the User Group to start using these resources; join now, no cost. 12.05.13 -- Local Area Employment and Unemployment Monthly Update - component of ProximityOne Situation & Outlook Database - September & October 2013 estimates released; available for all counties - access via http://proximityone.com/cv_apigateway.htm 11.26.13. National/State/Metro Quarterly Housing Price Index Updates - component of ProximityOne Situation & Outlook Database - data for 2013Q3 and quarterly trends - interactive ranking table -- http://proximityone.com/hpi.htm 11.22.13 -- ProximityOne User Group - exclusively to members: software, data access and application support privileges - no fees; view benefits: http://proximityone.com/usergroup.htm 11.21.13 -- Regional Economic Information System Updates - using & comparing these data to related data: ProximityOne Blog - interactive data access & comparison: http://proximityone.com/reis13.htm 11.16.13 -- Decision-Making Information Web Sessions - development, integration and use of Decision-Making Information -- selected topics - one hour Web sessions: http://proximityone.com/dmisessions.htm 11.16.13 -- Using Census 2010 Summary File 1 with API Technology - skip the downloads! start using the APIGateway to access SF1 block data - see overview in ProximityOne blog 11.15.13 -- Neighborhood Patterns of Economic Prosperity by Congressional District - mapping median household income by census tract in context of congressional districts - see overview in ProximityOne blog 11.06.13 -- State Legislative Districts Urban/Rural Characteristics - examine America's 6,558 state legislative districts by urban/rural population & land area - interactive table: http://proximityone.com/sld2013.htm 10.29.13 -- Public Use Microdata Area (PUMA) Geography - geography for ACS PUMS 2012 custom demographic estimates - interactive table; GIS & mapping: http://proximityone.com/puma2010.htm 10.28.13 -- State Median Household Income; 2000-2012 - real U.S. median household income decreased 6.6 percent,2000-2012 - interactive table; map visual analysis: http://proximityone.com/statetrendsmhi_20002012.htm 10.23.13 -- America's Demographic-Economic Profile -- 2012 - demographic-economic mosaic of approximately 600 most widely used subject matter - see http://proximityone.com/acs2012_usdp2.htm 10.16.13 -- GIS Tools for Metro Gross Domestic Product Analysis - Create thematic maps US by Metro by GDP/GDP components; annual time series - see http://proximityone.com/metrogdp1.htm 10.07.13. -- Examining Low and Moderate Income Census Tract Patterns - 2013 HMDA Census 2010 & ACS demographics - GIS tools and national scope census tract shapefile with integrated data; no fee; no registration - examples and getting started: http://proximityone.com/tractslmi.htm 10.01.13 -- U.S. by County Population Projections to 2060 Updated - time series; 2010 to 2060; single year of age by race/origin by gender - examples & details: Outlook 2060 09.26.13 -- County Quarterly Establishments-Employment-Earnings - time series; new 2013Q1 data released 9/26; available each/all counties - employment, establishments, payroll by type of business/NAICS - access via http://proximityone.com/cv_apigateway.htm 09.22.13 -- 2012 Elections & Vote by Candidate - Presidential, Senatorial and each Congressional election - vote count and percent vote by election, party, candidate - interactive analysis table: http://proximityone.com/2012elections.htm 09.20.13 -- American Community Survey 2012 1-year Estimates - 2012 demographics-economic estimates for areas of 65,000 population or more. - access via http://proximityone.com/cv_apigateway.htm - more about these data http://proximityone.com/acs2012.htm 09.17.13 -- Gross Domestic Product (GDP) by Metro - 2001-2012 annual GDP estimates with industry detail. - see http://proximityone.com/metrogdp.htm ... uses 2013 vintage metros 09.09.13 -- TIGER 2013 & Digital Map Database (DMD) Updates - selected data from TIGER 2013 being integrated into DMD - see more: http://proximityone.com/tigerline.htm 09.02.13 -- Examining Demographics by Race - using the "Some Other Race" category; allocating to specified race categories - see more: http://proximityone.com/some_other_race.htm 08.28.13 -- Local Area Employment and Unemployment Monthly Update - component of ProximityOne Situation & Outlook Database - July 2013 estimates released; available for all counties - access via http://proximityone.com/cv_apigateway.htm 08.25.13. Business Establishments by ZIP Code by NAICS Code - view/rank/compare establishments by ZIP by type of business -- interactive table - Health Care sector establishments by ZIP by NAICS by employment interactive table 08.22.13. National/State/Metro Quarterly Housing Price Index Updates - data for 2013Q2 and quarterly trends; uses 2013 vintage metros - interactive table: http://proximityone.com/hpi.htm 07.30.13. GeoGateway Update ... making custom maps from scratch - download shapefiles to your computer; all CV XE versions including no fee viewer .. installer - integrated auto-build custom GIS project from national scope to neighborhood scale - see details and examples ... Oneida County NY example ... Broward County FL example ... any county/state/region 07.15.13. County to County Migration - inbound, outbound and net movers for each/all counties - interactive table: query/rank/compare county to county flows - http://proximityone.com/county_migration.htm 07.08.13. U.S. Population Projections to 2060 - examine annual population projections to 2060 - interactive table; single year of age and age groups - see http://proximityone.com/outlook2060us.htm 07.02.13. State Population Components of Change - examine annual population components of change since 2010 - how are births, deaths and migration impacting state population? - see http://proximityone.com/statetrends2012.htm 06.28.13. State Single Year of Age 2010-2011-2012 Updates/Profiles - examine 2010, 2011, 2012 population estimates by single year of age - how are cohorts of interest changing? U.S. and individual state profiles - see http://proximityone.com/stateage.htm 06.25.13. County Demographic Trends: 5-year Age Cohort Patterns - examine 2010, 2011, 2012 population estimates by 5-year age cohort - view, rank, compare counties; interactive table - see http://proximityone.com/countytrends2012.htm 06.19.13. Top 50 Bank Holding Companies - examine how the largest bank holding companies compare and are changing - view, rank, compare companies; interactive table - see http://proximityone.com/bhco.htm 05.31.13. City, County, State Daytime Population - examine workers living/working in area; population change due to commuting; employment/residence ratio - view, rank, compare cities, counties and states; interactive ranking table - see http://proximityone.com/daytime_population.htm 05.28.13. APIGateway - access data from Census 2010, 2000, 1990; ACS 2010, 2011 and other sources using the APIs - use APIs to integrate multi-sourced data, join data to shapefiles, create custom spreadsheets - see http://proximityone.com/cv_apigateway.htm 05.16.13. Associating Addresses/Locations with Census Block Codes - convert address/location latitude-longitude to census block geocodes - from the census block code relate your location to wide-ranging political/statistical areas - examine demographic-economic characteristics of location vicinity - see http://proximityone.com/cv_p2g.htm 05.14.13. Analyzing EEO/Workforce Patterns - using the ACS 2010 EEO/Workforce special tabulation - unique features enable affirmative action & workforce insights to county/place levels - see http://proximityone.com/acs0610_eeo.htm 05.06.13. TIGER/Line Improvement & Digital Map Database - Census Bureau TIGER/Line data being augmented for improved GIS, mapping and geospatial operations - join in ... participate in Digital Map Database development and use - see http://proximityone.com/dmd.htm 04.29.13. ACS 2011 School District Special Tabulation - children's demographics and their living environment by school district & type of enrollment - updates ACS 2010 estimates http://proximityone.com/sdst0610.htm - new data interactive table http://proximityone.com/sdst0711.htm 04.24.13. New Site Analysis Tools: Examine Demographic-Economic Characteristrics of Locations, Areas & Corridors - CV XE GIS Site Analysis provides visual and tabular analysis of sites and service/market areas - run site analysis operations using existing GIS projects; unlimited geographic-demographic-economic scope - see http://proximityone.com/cv_siteanalysis.htm 04.22.13. Federal Geographic-Statistical Data Access Using APIs - topics concerning improving data driven decision-making through APIs - Federal agency use of API technologies to facilitate more effective data access and usability - see http://proximityone.com/fssapi.htm 04.12.13. Analyzing Washington DC Metro & Neighborhoods using GIS Resources - tools to explore demographic-economic patterns & relationships: metro/county to intersection - examining characteristics of sub-neighborhoods proposed for redevelopment - see http://proximityone.com/cv_washingtondc.htm 04.08.13. Site Analysis & Block Group Demographic-Economic Database - resources to create comparative analysis demographic-economic profiles - GIS ready: national scope block group shapefile with integrate detailed subject matter - more: http://proximityone.com/bgdata.htm 04.05.13. Examining Political/Statistical Geography in Context of OpenStreetMap WMS - options to examine boundaries in context of roads/ground coverage - pros & cons of using roads shapefiles vs OpenStreetMap WMS - census tract applications: http://proximityone.com/cv_osm.htm 04.01.13. Largest 100 School Districts Updated with 2012-13 Enrollment Data - 2010-11, 2011-12 & 2012-13 enrollment data updated for largest 100 school districts - NYC increases; LA Unified and Chicago decline - interactive table: http://proximityone.com/lgsd.htm 03.29.13. Healthcare DMI: Life Expectancy Trends by County - examine life expectancy trends by gender: 1990-2007 - male life expectancy ranges 65.9 to 81.1 years in 2007 - U.S. by county interactive table: > interactive table: http://proximityone.com/hcdmi_le.htm 03.27.13. County Demographic-Economic Trends - 2000-2010; post-census 2010 estimates; richer demographic-economic estimates - U.S. by county interactive table: > interactive table: http://proximityone.com/countytrends.htm 03.25.13. Healthcare Decision-Making Information Updates - using GIS to analyze healthcare infrastructure; integrating multi-sourced data - health insurance coverage; selected geographies > interactive table: http://proximityone.com/hcdmi.htm 03.21.13. National/State/Metro Quarterly Housing Price Index Updates - component of ProximityOne Situation & Outlook Database - 2012Q4 and quarterly trends; interactive table: http://proximityone.com/hpi.htm 03.18.13. Examining Demographic-Economic Characteristics of Cities/Places - latest post-census estimates & 2000-2010 trends; all 29,000+ cities/places - characteristics of new 2013 metro principal cities - view, query, rank, compare patterns; national scope interactive table - see details http://proximityone.com/places.htm 03.15.13. Examining Largest & Fastest Growing 2013 Vintage Metros - latest post-census demographic estimates & 2000-2010 trends - view, query, rank, compare patterns; national scope interactive table. - see details http://proximityone.com/metros2013.htm 03.07.13. New Official Metropolitan Area Designations - OMB announces revised delineations of Metropolitan Statistical Areas (MSAs), Micropolitan Statistical Areas (MISAs) and Combined Statistical Areas (CSAs) - 929 metros (MSAs and MISAs) now exist in the U.S. and Puerto Rico - more information at http://proximityone.com/metros2013.htm 03.06.13. 113th Congressional District Interactive Ranking Tables - ACS 2011 1-year 113th Congressional District demographic-economic ranking tables - General Demographics -- http://proximityone.com/cd11311dp1.htm - Social Characteristics -- http://proximityone.com/cd11311dp2.htm - Economic Characteristics -- http://proximityone.com/cd11311dp3.htm - Housing Characterictics -- http://proximityone.com/cd11311dp4.htm 03.05.13. Analytical Resources: Census 2010 Block Group Demographics Dataset - National scope Census 2010 race/ethnicity data by block group; CSV file - Dataset developed using S&O Server "All BGs" feature - See details http://proximityone.com/blockgroups.htm#bgdata 03.04.13. 113th Congressional District Demographic-Economic Profiles - ACS 2011 1-year 113th Congressional District demographic-economic profiles - View example for New York 12th -- http://proximityone.com/cd113_profiles.htm - Data available for single districts, sets of districts or all districts in various formats - Contact us for more information (mention ACS 2011 CD Profiles in text section) 03.01.13. Potential Impact of Sequester on School Districts - mapping patterns of school districts by percent revenue from Federal sources. - view districts most vulnerable to reductions in Federal funding. - school districts shown in context of 113th Congressional Districts. - see http://proximityone.com/sdfa_cd.htm 02.28.13. S&O Server Update -- Many New Datasets - many new datasets now accessible - 1990 Census SF1/SF3; 2000 Census SF1/SF3; ACS 2011 1-year 113th Congressional Districts - dataset summary: http://proximityone.com/s&o/guide/server_datasets.htm 02.25.13. Examining Poverty Status by Age by Census Tract - latest estimates of population by poverty status by age by census tract - view, query, rank, compare patterns; national scope interactive table. - examine thematic patterns with GIS; example: Austin ISD, Texas - access data: http://proximityone.com/tracts_poverty.htm 02.20.13. S&O Server New Geocoder Feature - convert/translate latitude-longitude coordinates to corresponding census block geocode - higher level geocode assignment also available: block group, census tract, county, metro, state etc. - related geoprocessing and location based features. - see more about S&O Geocoder 02.18.13. Resources to Analyze Native American Area Demographic-Economic Characteristics - use the S&O Server to examine detailed characteristics of Native American areas - example for Navajo Nation - all American Indian, Alaska Native and Hawaiian Home Land Areas - view/query/compare areas using interactive table - see http://proximityone.com/aianhhl.htm 02.15.13. Examining Labor Force Status by Block Group & ZIP Code - labor force status attributes by block group from ACS 2010, ACS 2011 & Census 2010 - view, rank, compare, query employment and unemployment by block group - national scope interactive block group-ZIP code equivalence table - see http://proximityone.com/blockgroups.htm 02.13.13. S&O Server New Custom Spreadsheet Feature - build custom spreadsheet for any mix of ACS2010 ACS2011 Census2010 items - any mix of geography including census block and block group - see extended profile block group example with ACS2010 ACS2011 Census2010 mix - see more about S&O Custom Spreadsheet 02.07.13. School District Special Tabulation Update - school age population by age group and enrollment status - new profiles for each/every school district - click link for school districts of interest in interactive table: ... http://proximityone.com/sdst0610.htm 02.01.13. Citizen Voting Age Population Patterns by Census Tract - ACS 2011 5-year special tabulation estimates - citizen voting age population by race/ethnicity - using these data with tools to analyze compliance with Voting Rights Act - interactive ranking table ... http://proximityone.com/tracts_cvap.htm 01.25.13. 113th Congressional District Demographics - new data based on American Community Survey 2011 1-year estimates. - tabulations for the new 113th congressional district boundaries. - See more http://proximityone.com/cd113_demographics.htm. 01.24.13. ZIP Code to 113th Congressional District Equivalencing - ZIP Code to 113th Congressional District data now available. - Determine 5-digit ZIP Codes that intersect with 113th CDs. - Web-based interactive query/view table and data file. - See more http://proximityone.com/cd113.htm. 01.22.13. -- Situation & Outlook Quarterly Database Update information 01.15.13. Examining Urban/Rural Demographic Patterns by Census Block - Using the updated (urban/rural; 113th CDs) Census 2010 Summary File 1. - Analyzing census block demographic patterns in context of cities & 113th congressional districts. > congressional districts: http://proximityone.com/cdgallery/guide/index.htm?ur_census_block.htm. - Using urban census blocks to reveal urban/rural make-up of school districts. > school districts: http://proximityone.com/urbanpopulation.htm#dallas 01.09.13. 10 Reasons to use Census Tracts Versus ZIP Code Geography & Demographics #1. Census tracts are polygons and cover a well-defined geographic area. ZIP codes are clusters of lines; the U.S. Postal Service does not define ZIP Code boundaries. ... see more: http://proximityone.com/tracts_zips.htm 01.08.13. CD Gallery Updated: 113th Congress Congressional District Map Views - State by congressional district maps for all states; sub-state zoom-in for many states. - District specific focus maps available in all states. ... statewide district focus maps: AL,AK,AZ,AR,CA,CO,CT,DE,FL,GA,HI,ID,IL,KS,MO,MT,NH,ND,PA,SD,TX,VT,WY ... district focus maps show CD boundary and thematic pattern map. ... economic prosperity (median household income) by neighborhood/census tract. - http://proximityone.com/cdgallery/guide/ 12.27.12. Custom Demographic-Economic Comparative Analysis Reports - New resources facilitate strategic planning - About the DECA reports: http://proximityone.com/deca_reports.htm - Sample for Santa Fe NM - http://proximityone.com/s&o/profiles/santafe_dpintro.htm 12.21.12. Resources to examine the school district community -- updated today - School District Community & Strategic Planning: http://proximityone.com/sdcommunity.htm 12.20.12. State Metro County Demographic-Economic Ranking Tables - several hundred (600+) most widely used subject matter items; all states, metros, counties - based on ACS 2011 and related data; released December 2012 - view/rank/compare metro demographic-economic attributes; develop regional/metro by county profiles - General Demographics -- http://proximityone.com/us11dp1.htm - Social Characteristics -- http://proximityone.com/us11dp2.htm - Economic Characteristics -- http://proximityone.com/us11dp3.htm - Housing Characteristics -- http://proximityone.com/us11dp4.htm 12.16.12. Guide to Data Resources & Tools to Examine the School District Community - Overview and links to key data resources and analytical tools - Demographic, economic, geographic & infrastructure characteristics & patterns - http://proximityone.com/sdcommunity.htm 12.16.12. City/Place District Demographic-Economic Interactive Ranking Tables - several hundred (600+) most widely used subject matter items ACS 2011; all cities/places - General Demographics -- http://proximityone.com/pl11dp1.htm - Social Characteristics -- http://proximityone.com/pl11dp2.htm - Economic Characteristics -- http://proximityone.com/pl11dp3.htm - Housing Characteristics -- http://proximityone.com/pl11dp4.htm 12.15.12. School District Demographic-Economic Interactive Ranking Tables - several hundred (600+) most widely used subject matter items ACS 2011; all school districts - General Demographics -- http://proximityone.com/sd11dp1.htm - Social Characteristics -- http://proximityone.com/sd11dp2.htm - Economic Characteristics -- http://proximityone.com/sd11dp3.htm - Housing Characteristics -- http://proximityone.com/sd11dp4.htm 12.10.12. Census Tract Demographic-Economic Interactive Ranking Tables - several hundred (600+) most widely used subject matter items; ACS 2011; all census tracts - General Demographics -- http://proximityone.com/tracts11dp1.htm - Social Characteristics -- http://proximityone.com/tracts11dp2.htm - Economic Characteristics -- http://proximityone.com/tracts11dp3.htm - Housing Characteristics -- http://proximityone.com/tracts11dp4.htm 12.09.12. S&O Server Version 1.1 Released - New extract/display/analysis operations - Support for ACS 2011 - Data for new geographic levels including school districts and ZIP Code areas. - http://proximityone.com/s&o/guide/server.htm 12.07.12. ZIP Code Area Demographic-Economic Interactive Ranking Tables - several hundred most widely used subject matter items ACS 2011; all ZIP Code Areas - General Demographics -- http://proximityone.com/zipdp1.htm - Social Characteristics -- http://proximityone.com/zipdp2.htm - Economic Characteristics -- http://proximityone.com/zipdp3.htm - Housing Characteristics -- http://proximityone.com/zipdp4.htm 12.06.12. American Community Survey 2011 5-year estimates - 2011 "richer demographics" - national scope data for blockgroups, census tracts, . - updates to corresponding ACS 2010 demographics released December 2011. - http://proximityone.com/acs0711.htm 11.30.12. Geographic Mobility: County to County Migration Analysis - Number of movers in and number of movers out by county. - National scope; all counties; foreign areas included. - First county to county mobility updates since Census 2000. - Visual analysis (GIS/thematic mapping) of mover patterns. http://proximityone.com/countymigration.htm 11.29.12. ACS 2010 Equal Employment Opportunity Special Tabulation - Analytical value far transcends EEO applications. - Based on American Community Survey 2010 5 year estimates. - Corresponds to Census 2000 EEO Special Tabulation. - Detailed attributes of workforce; extended industry & occupational detail. - Place of work and place of residence data; cities/places, counties, CBSAs. - http://proximityone.com/acs0610_eeo.htm 11.28.12. State Standardized High School Graduation Rates - State-by-state standardized definition 4-year high school graduation rates; interactive ranking table . - Computed by states per U.S. Department Education guidelines; 2010-11 school year. - For the first time, reflect a common method of calculation for all states. - Rates for selected student categories. - http://proximityone.com/hs_grad_rates.htm 11.25.12. Asian Demographic Characteristics & Patterns Updated - Broader national scope data based on Current Population Survey 2011 results. - Asian Outlook 2060 demographic-economic estimates & projections in December. - http://proximityone.com/cen2010_asian.htm - new section: http://proximityone.com/demographics_asian.htm 11.21.12. Demographic Characteristics of the Population Age 65 & Over - continuously updated focus section on the population age 65 & over. - demographic characteristics of this group (number, geographic distribution, patterns, trends and other attributes, etc. - related broader demographic-economic issues. - information resources useful to stakeholders to examine these topics. - http://proximityone.com/demographics65up.htm 11.20.12. Situation & Outlook Demographic-Economic Monthly Employment Update - component of ProximityOne Situation & Outlook Database - labor force characteristics update for October 2012 - updated narrative profiles available online/downloadable 11.15.12. Analyzing Age-Gender Structure using ChartGraphics Resources - Create/publish population pyramids and associated data tables. - Integrated ready-to-use database; Census 2000 and Census 2010. - U.S. national scope data: U.S., states, counties; add your own data. - Age-gender data by extended set of race groups and Hispanic origin. - http://proximityone.com/populationpyramids.htm 11.14.12. Metro Area Age-Gender Demographics Pattern Analysis - Compare 2000 & 2010 age-gender demographics for any CBSA to any other CBSA. - Population pyramids plus extended Census 2000 and Census 2010 underlying Excel datasets. - Core-Based Statistical Areas (CBSA) -- Metro and Micro Statistical Areas. - http://proximityone.com/populationpyramids.htm#cbsa 11.12.12. Examining 113th Congressional Districts & Economic Prosperity - Using GIS resources to analyze new congressional districts with patterns of median household income by census tract. - http://proximityone.com/gallery/guide/113th_congressional_districts.htm 11.08.12. Examining 113th Congress Representatives: Ranking Table & GIS Resources - Results from November 6 elections. - Analyze, view, rank, compare, query representatives by district. - ranking table -- http://proximityone.com/cd113.htm 11.05.12. Census 2010 Summary File 2 U.S. by State/County DP1 Ranking Table - Demographic Profile 1 (DP1) demographic subject matter items. - U.S., states, counties. - Total population and 16 selected race groups. - Analyze, view, rank, compare, query. - ranking table -- http://proximityone.com/cen2010_sf2.htm 11.02.12. ACS EEO/Workforce Special Tabulation Takes Form; Nearing Release - Employment related tabulations from American Community Survey 2010 5-year universe. - Employment attributes by place of work and place of residence with extended occupational detail. - Special tabulation universes, geography and subject matter. - Data release data 11/29/12. - ProximityOne develops new countyset labor market areas shapefile (view related maps) - details -- http://proximityone.com/acs2010_eeo.htm 10.22.12. 113th Congressional District Boundaries/Shapefiles Available National scope data are now available: - 113th Congressional District (CD) boundaries in shapefile structure. - Corresponding state upper (SU) and lower (SL) house boundary shapefiles. - Census 2010 census block to 113th CD, SU and SL equivalence files. - ProximityOne Census 2010 demographics data by 113th CD, SU and SL. - ProximityOne ZIP Code-113th CD, SU and SL equivalence file and demographics. - Congressional Districts section -- http://proximityone.com/cd.htm - view national scope map in gallery -- http://proximityone.com/gallery/guide/113th_congressional_districts.htm 10.19.12 -- Situation & Outlook Demographic-Economic Employment Monthly Update - component of ProximityOne Situation & Outlook Database - labor force characteristics update for September 2012 - updated narrative profiles available online/downloadable 10.17.12. -- U.S. Public Schools Interactive Ranking Table - Examine school-level characteristics for 100,000+ schools - Use interactive ranking table to view/compare/rank individual schools http://proximityone.com/k12publicschools.htm 10.16.12 -- School Enrollment by State by Age and Type of Enrollment: 2011 - Examine U.S. trends 2008-2011 annual data - Use interactive ranking table to view/compare/rank states by type of enrollment http://proximityone.com/school_enrollment.htm 10.15.12 -- State & Regional Sections Updated/Extended - new annual county intercensal population estimates with race/origin ranking tables. - select/view main section or state of interest:
Main section
Alabama Alaska Arizona Arkansas California Colorado Connecticut Delaware District of Columbia Florida Georgia Hawaii Idaho Illinois Indiana Iowa Kansas Kentucky Louisiana Maine Maryland Massachusetts Michigan Minnesota Mississippi Missouri Montana Nebraska Nevada New Hampshire New Jersey New Mexico New York North Carolina North Dakota Ohio Oklahoma Oregon Pennsylvania Rhode Island South Carolina South Dakota Tennessee Texas Utah Vermont Virginia Washington West Virginia Wisconsin Wyoming 10.11.12 -- State Monthly Employment and Unemployment Trends - monthly update; national scope - http://proximityone.com/state_employment.htm 10.08.12 -- American Community Survey 2011 - new ranking tables - new demographic-economic interactive ranking tables - U.S., states, school districts, metros/MSAs, counties, cities, congressional districts - Several hundred most widely used subject matter items - General Demographics -- http://proximityone.com/acs2011dp1.htm - Social Characteristics -- http://proximityone.com/acs2011dp2.htm - Economic Characteristics -- http://proximityone.com/acs2011dp3.htm - Housing Characteristics -- http://proximityone.com/acs2011dp4.htm 10.05.12 -- American Community Survey Section Additions & Updates - ACS main updated -- http://proximityone.com/acs.htm - ACS 2011 new -- http://proximityone.com/acs2011.htm 10.03.12 -- Video: Using GIS to Examine School Locations & Geographic Relationships - illustrating school-related GIS application in Houston, TX area - step by step views of how this type of GIS project can be developed - next video: using GIS to visually analyze school/neighborhood demographic patterns - http://proximityone.com/gallery/videos/txschools1.html 09.28.12 -- Situation & Outlook Demographic-Economic Profiles - profiles showing wide-ranging demographic-economic attributes. - continuously updated profiles; featuring data from ACS 2011 released in September 2012. - Census 2000, ACS 2011 and change; with more current 2012 monthly updates. - select U.S. or state of interest:
United States
Alabama Alaska Arizona Arkansas California Colorado Connecticut Delaware District of Columbia Florida Georgia Hawaii Idaho Illinois Indiana Iowa Kansas Kentucky Louisiana Maine Maryland Massachusetts Michigan Minnesota Mississippi Missouri Montana Nebraska Nevada New Hampshire New Jersey New Mexico New York North Carolina North Dakota Ohio Oklahoma Oregon Pennsylvania Rhode Island South Carolina South Dakota Tennessee Texas Utah Vermont Virginia Washington West Virginia Wisconsin Wyoming 09.27.12 -- National/State/Metro/County Quarterly Establishments-Employment-Earnings - component of ProximityOne Situation & Outlook Database - raw data for 2012Q1 released by Bureau of Labor Statistics - available for all metros in interactive ranking table: http://proximityone.com/metroeee.htm 09.25.12 -- 2010-11 National School District Demographics Update - 2010-11 enrollment by grade, gender, race/origin, program participation, schools, teachers, staff and related. - access via Web interactive ranking table. - access extended data, profiles and analysis via Situation & Outlook: http://proximityone.com/sddmi.htm 09.24.12. -- Demographic-Economic Ranking Table Updates - use demographic-economic ranking tables with your desktop or mobile device - interactively examine characteristics of wide-ranging geography including states, metros, congressional districts, school districts, schools, census tracts, block groups, blocks, ZIP codes and others ... http://proximityone.com/rankingtables.htm 09.21.12 -- Household Income Continues Decline, 2010-2011 - U.S. median household income continues decline ... falling 1.3% from 2010 to 2011, from $51,144 to $50,502 - examine Gini Index showing measures of income inequality - compare and rank states with interactive ranking table - see http://proximityone.com/statetrends_income.htm. 09.14.12 -- Median Gross Rent Trends by Metro: 2008-2010 - extends on Metro Rental Markets section - median gross rent for 2008, 2009, 2010 and change by metro - compare and rank metros with interactive ranking table - see http://proximityone.com/metro_rentalmarket_trends.htm. 09.14.12 -- Rental Market Conditions by Metropolitan Area - updated ... examine metro rental market conditions. - compare and rank metros with interactive ranking table - view interactive ranking table http://proximityone.com/metro_rentalmarket.htm 09.11.12 -- National Scope K-12 Private Schools - interactive ranking table ... view/rank/query individual K-12 private schools - compare/examine characteristics of individual schools - rank/view largest schools by type in states/areas of interest - http://proximityone.com/k12privateschools.htm 09.06.12 -- School Districts by State -- 1952-2012 - use interactive ranking table to view the number and type of school districts by state. - examining change in school districts by state infrastructure over the past 60 years. - view interactive ranking table http://proximityone.com/sdstate.htm 08.20.12 -- School District Revenue & Expenditure Patterns - use interactive ranking table to examine one or a set of school districts. - compare districts using total, percent and per student data. - updated with new FY 2010 financial data. - view interactive ranking table http://proximityone.com/sdfa.htm 08.07.12 -- Situation & Outlook Server - using Census APIs to access demographic data via Web server. - no-fee, no-registration. - Census 2010 Summary File 1 data down to census block. - American Community Survey data data down to block group. - more information ... http://proximityone.com/s&o/guide/server.htm 07.02.12 -- Block Group Demographic-Economic Site Analysis Profiles - view demographic-economic site analysis profiles - select one block group (BG) area or many - pick BG by geocode(s) or based on an address or latitude-longitude - examine XLS and/or HTML report; N-mile site radius http://proximityone.com/blockgroups.htm 06.11.12 -- ZIP Code to Census Tract Equivalence & Interactive Ranking Table - determine which census tracts intersect with ZIP codes of interest - determine which ZIP codes intersect with census tracts of interest - examine how a ZIP code area demographics are distributed by census tract - interactive ranking table: http://proximityone.com/ziptractequiv.htm 06.08.12 -- Examining Asian Population Patterns - America's Changing Race Patterns: Census 2000 to Census 2010 - section updated with extended Asian race category details - interactive ranking table: http://proximityone.com/cen2010_asian.htm 06.04.12 -- State & National Employment Situation & Trends - national scope state-by-state alternative measures of labor utilization - state profiles of the employment situation - interactive ranking tables: http://proximityone.com/state_employment.htm 06.01.12 -- 1930 Vintage Metropolitan Districts: How America's Metros Have Changed - examining characteristics of the 96 1930 vintage U.S. metropolitan districts - forerunner of today's core-based statistical areas http://proximityone.com/metros.htm 05.30.12 -- ACS 2010 School District Special Tabulation - first school district "richer demographics" for children by type of enrollment using Census 2010 school district boundaries - more details; results from corresponding ACS 2009 special tabulation: http://proximityone.com/sdst0610.htm 05.17.12 -- Census Bureau State & County Population Estimates - by Age, Sex, Race and Hispanic Origin: July 1, 2011 http://proximityone.com/countytrends.htm 05.13.12. -- ACS 2010 Public Use Microdata Sample (PUMS) Custom Estimates - using PUMS2012 software to develop custom demographic estimates. http://proximityone.com/puma2012.htm 05.10.12. -- ACS 2010 School District Special Tabulation - children's demographic and living characteristics by school district. - demographic tabulated by type of enrollment universe. - all school districts interactive ranking table using 2009-10 boundaries. http://proximityone.com/sdst0610.htm 05.09.12. -- Census 2000 Public Use Microdata Area (PUMA) Boundaries Using Census 2010 Geography - existing Census 2000 PUMA boundaries/shapefiles are used with ACS 2010/2011 PUMS. - create Census 2000 PUMA shapefiles using Census 2010 geography. http://proximityone.com/puma2000.htm 05.07.12. -- Web Meetings Schedule Updated http://proximityone.com/webmeetings.htm 05.07.12. -- Outlook 2060: National & State Demographic Projections to 2060 http://proximityone.com/outlook2060.htm 05.04.12. -- Examining Linguistic Isolation by Block Group - using ACS 2010 block group demographics - interactive ranking table and GIS visual analysis http://proximityone.com/language_spoken.htm 04.30.12. -- County/Regional Personal Income Annual Updates - most comprehensive measures of county+ economic activity and patterns - national scope PCPI trends interactive ranking table http://proximityone.com/pcpi.htm - detailed data: Honolulu, HI - detailed data: Collin County, TX (Dallas Metro) 04.26.12 -- Census 2010 Summary File 2 National & State Files released - Selected SF1 Tables iterated by up to 331 detailed race and ethnic groups; census tracts up http://proximityone.com/cen2010.htm 04.15.12. -- Census 2000 to Census 2010 Census Tract Relationship Reports - FFIEC HMDA & CRA applications. - any applcation where correspondence between Census 2000 and Census 2010 tracts required. http://proximityone.com/tracts_2000_2010.htm 04.15.12. -- Census 2010 Demographics for Census 2000 Census Tracts - National scope interactive ranking table. http://proximityone.com/tracts0010.htm 04.15.12. -- Census Tracts Main Page Updated http://proximityone.com/tracts.htm 04.05.12 -- 2011 National and State population and demographic components of population change - Census Bureau post Census 2010 population estimates using components of change - Estimates for July 1, 2011. http://proximityone.com/countytrends.htm 04.03.12 -- Census 2010 Urban Area Demographics and Shapefiles - New Shapefiles for Census 2010 Urban Areas - New Urban/Rural Demographics. http://proximityone.com/urbanpopulation.htm 03.28.12 -- National/State/Metro/County Quarterly Establishments-Employment-Earnings - component of ProximityOne Situation & Outlook Database - raw data for 2011Q3 released by Bureau of Labor Statistics - available for all metros in interactive ranking table: http://proximityone.com/metroeee.htm 03.26.12 -- CV XE GIS 3-D Visual Pattern Analysis - application examples: Washington DC Educational Attainment by Block Group - thematic pattern analysis: percent population with bachelor degree or higher - elevation scale: number of people 25 years or over http://proximityone.com/cvxe_3d.htm 03.21.12 -- Integrating Census Bureau Web Map Server with Shapefiles - Using CV XE GIS to view Census Bureau Web Map Server (WMS) geography. - Adding Census-sourced and other shapefiles to WMS-based projects. http://proximityone.com/cvxe_wms.htm 03.15.12 -- Using the GeoGateway & Map Compiler -- a GeoCloud Solution - use the new CV XE GIS feature to build your GIS projects - all Census 2000 and Census 2010 shapefiles and more. - single county, region/metro, state or national scope geographic extent. http://proximityone.com/cv.htm 03.13.12 -- Census 2010 Urban Area Demographics and Shapefiles - New Shapefiles for Census 2010 Urban Areas - New Urban/Rural Demographics. http://proximityone.com/urbanpopulation.htm 03.10.12 -- ProximityOne CV XE GIS Software Released - latest generation CV XE geographic information system software - review feature; install on your computer. http://proximityone.com/cv.htm 02.15.12 -- Hawaii Demographics -- New Sections - Hawaii Demographic-Economic Statistical System http://proximityone.com/hawaii_demographics.htm - Hawaii High School Complex Demographics http://proximityone.com/hawaii_demographics_hsc.htm - Analyzing Hawaii Block Group Demographics http://proximityone.com/hawaii_demographics_bg.htm - Hawaii Census Tract Demographics http://proximityone.com/ustr0509_hi.htm - Hawaii Geographic Information System Resources http://proximityone.com/hawaii_demographics_gis.htm 01.15.12. -- Use Demographic-Economic Ranking Tables with your iPad - use the demographic-economic ranking tables with your iPad - iPad/iPhone (iOS 5+) and all major browsers: Internet Explorer, Firefox, Safari, Opera & Chrome on Windows, Mac OS X & Linux http://proximityone.com/rankingtables.htm 01.22.12. -- 2010 ACS Equal Employment Opportunity (EEO) Under Development - first EEO special tabulation updates since Census 2000 EEO special tabulation - enabling EEOC compliance analyses and wide range of other workforce analyses - http://proximityone.com/acs0610_eeo.htm 12.08.11. -- 2010 American Community Survey (ACS) 5-year Estimates - 2008 centric "richer demographic" estimates for school districts, places, & census tract up - census tracts & school districts (unlike ACS 2009) use Census 2010 boundaries - All U.S. Census Tract Demographics Interactive Ranking Table - http://proximityone.com/acs0610.htm 12.07.11. Google Maps API & Census 2010 Census Tract Demographics Integrate location data (eg, schools, banks) with Census 2010 geography and demographics. Access/link Census 2010, ACS 2010 and estimates & projections with Google maps. http://proximityone.com/sd/36/m3614850b.htm 11.29.11. Compare Census 2010 Demographics with ACS 2010 1-Year Estimates View/rank/compare demographic characteristics for 3,372 largest (65,000+ population) "Most current" Census-sourced demographics U.S., states, cities/places, counties, metros, school districts, congressional districts Access via http://proximityone.com/acs2010.htm 11.21.11. Congressional District Comparative Analysis Demographic Profiles Congressional districts added to Demographic-Economic Statistical System (DESS) Compare demographics for congressional districts to other districts and other geography Access via http://proximityone.com/dess.htm 11.18.11. U.S. by County Population Estimates by Single Year of Age: 2000 to 2010 Intercensal Population Estimates by Single-year of Age, Sex, Bridged-Race, and Hispanic Origin Annual July 1, 2000 to July 1, 2009 and April 1, 2010 New ... http://proximityone.com/countytrends2.htm 11.16.11. State-to-State Migration: 2010 Examining state-to-state migration for 2010. New ... http://proximityone.com/statemigration10.htm 11.08.11. Establishments Database & Information System (EDIS) Expansion of Major Retail Stores Locations slated for 2012. New ... http://proximityone.com/edis.htm Updated ... http://proximityone.com/mrsl.htm Quarterly updates/trends by metro ... Establishments, Employment & Earnings 11.07.11. Examining Patterns of Hawaii School Age Population by Block Group Census 2010 school age population by block group; thematic mapping. Hawaii Block Group Pattern Analysis 11.07.11. Analyzing Block Group Demographics Review of resources available to analyze block group geography and demographics. http://proximityone.com/blockgroups.htm Hawaii Block Group Pattern Analysis 11.07.11. Examining the School District Community School District "Richer Demographic" Profiles Added/Updated. See state-by-state list ... http://proximityone.com/sddmi.htm 11.04.11. American Community Survey 2010 Section Updated Highlights of ACS 2010 1-year estimates; Profile America. Review of applications, analyses & tools. http://proximityone.com/acs2010.htm 11.03.11. Illinois 2011 Enacted Redistricting Shapefiles Available View/examine new 2011 Illinois Congressional District & state house/senate map files Using GIS resources to examine the changing political landscape. http://proximityone.com/ers_il.htm 11.01.11. Guide to Information Resources about Schools, School Districts. K-12 Education List and brief description of links to key data in an analytical structure. Insights into the School District Community. http://proximityone.com/sdcommunity.htm 10.28.11. Census 2010 National Summary File 1 (SF1) Now available; includes ZIP Code and metro summary levels Tabulations for areas spanning state boundaries. http://proximityone.com/cen2010_sf1.htm 10.27.11. Accessing & Using Enacted Redistricting Shapefiles View/examine new Congressional District & state house/senate map files Using GIS resources to examine the changing political landscape. http://proximityone.com/ers.htm 10.17.11. Metro Establishments, Employment & Earnings by High Level Industry Group 2010 annual data quarterly data to 2011Q1; updated quarterly. E-E-E data integrated with 2010 Census and 2010 ACS demographics. Get individual detailed metro reports ... Dallas example. Main page & ranking table ... http://proximityone.com/metroeee.htm 10.14.11. Examining City/Place to County Relationships Many cities/places are located in multiple counties. See more about examining city/place to county relationships in selected states. http://proximityone.com/places.htm 10.13.11. State and County Daytime Population Updates Examining daytime population by state & county; employment-residence ratios++. all U.S. state & county interactive ranking table. http://proximityone.com/stcty_daytime_population09.htm County main page updated: http://proximityone.com/countytrends.htm 10.11.11. City/Place Daytime Population Updates Examining daytime population by city; employment-residence ratios++. 25,000 city/all U.S. interactive ranking table. http://proximityone.com/city_daytime_population09.htm Places main page updated: http://proximityone.com/places.htm 10.10.11. Congressional Districts in Transition: Looking Ahead to the 113th Congress New 113th Congressional District and state legislative district boundaries becoming available. Start to examine demographic patterns within and among districts in advance of 2013. http://proximityone.com/cd.htm 10.04.11. 2011 ESEA Title I Allocations by School District Elementary and Secondary Education Act aka No Child Left Behind Largest U.S. educational funding program to assist disadvantaged children. View/rank/compare school district $ allocations and funding formula factors. http://proximityone.com/title1_2011.htm 10.03.11. Census 2010 Census Block Database Analyze selected set of 186 demographic items for each of more than 11 million census blocks. Map/site-analyze areas from intersection level up; create equivalence files. http://proximityone.com/cenblk.htm 10.03.11. Geographic Information Systems & Geospatial Solutions General update. http://proximityone.com/gis.htm 09.30.11. Congressional District Income & Poverty Characteristics: 2009-2010 Examine selected income & poverty characteristics by CD: 2009, 2010 and change Use interactive ranking table to compare/contrast/rank all CDs or a specific state http://proximityone.com/cd_income0910.htm 09.27.11. Rental Market Conditions & Analysis Metro rental markets; updated: http://proximityone.com/metro_rentalmarket.htm ZIP Code rental market analysis; updated: http://proximityone.com/dallasrvr.htm 09.26.11. Congressional District Employment Situation: 2009-2010 Examine selected labor force characteristics by CD: 2009, 2010 and change Use interactive ranking table to compare/contrast/rank all CDs or a specific state http://proximityone.com/cd_employment0910.htm 09.23.11. State Median Household Income Patterns: 1990-2010 Median Household Income (MHI) in 1990 to 2010 and change by state Median household income declines in 35 states 2009-2010; interactive ranking table http://proximityone.com/stmhi0910.htm 09.22.11. Educational Attainment Trends Among States: 1990-2000-2010 Percent high school graduates & college graduates by state Interactive ranking table; data from new ACS 2010, 1990 Census & 2000 Census http://proximityone.com/edattain.htm 09.19.11. Analyzing Early Childhood Demographic Patterns by School District Single year of age demographics by school district Kindergarten-age, grade 1-age and grade 2-age populations in 2015 by district http://proximityone.com/sdage.htm 09.09.11. Demographic Data Analyst Software & Guide Updated ... accessing and integrating Census 2010 & America Community Survey Data with other data and into shapefiles http://proximityone.com/dda/guide 09.07.11. Measuring & Analyzing the U.S. Voting Population ... U.S. citizen voting age population by state/county/city-place for selected population groups http://proximityone.com/voting_population.htm 09.06.11. Voting Patterns by Congressional District: 2010 Elections ... votes cast by congressional district & party http://proximityone.com/2010election_house.htm 09.02.11. ZIP Code Demographics by School District ... see which Census 2010 ZIP Codes intersect with which school districts ... view/analyze demographics of ZIP Code areas by school district http://proximityone.com/zip-sd.htm 09.02.11. ZIP Code Demographics by Congressional District ... see which Census 2010 ZIP Codes intersect with which Congressional Districts ... view/analyze demographics of ZIP Code areas by Congressional District http://proximityone.com/zip-cd.htm 09.02.11. Dallas, TX Metro ZIP Code Rental Vacancy Rate Pattern Analysis http://proximityone.com/dallasrvr.htm 09.01.11. Ranking Tables Updated http://proximityone.com/rankingtables.htm 09.01.11. Census 2010 ZIP Code Demographic Ranking Table & Dataset Download http://proximityone.com/cen2010_zcta_dp.htm 08.31.11. Census 2010 ZIP Code Demographic Profile Dataset http://proximityone.com/cen2010_zcta_dp.htm 08.25.11. Census 2010 Summary File 1 completed for all states today http://proximityone.com/cen2010_sf1.htm 08.25.11. ZIP-Place Demographics Ranking Table updated ... covers all ZIP codes, all cities/places and non-city areas http://proximityone.com/zip-place.htm 08.25.11. DPSF2010: Census 2010 Demographic Summary File; new expanded geography http://proximityone.com/cen2010_dpsf2010.htm 08.20.11. Narrated videos on Using CommunityViewer & TXSDP Analysis - Dallas/Plano area overview --http://proximityone.com/txsdp3.htm ... video -- http://proximityone.com/mp4/txsdp-3/txsdp-3.htm - Houston area overview --http://proximityone.com/txsdp3_houston.htm ... video -- http://proximityone.com/mp4/txsdp-houston/txsdp-houston.html 08.17.11. State & Congressional District Urban-Rural Population ... new ranking table: states & congressional districts ... urban-rural patterns. http://proximityone.com/urban-rural.htm 08.17.11. Census 2010 Summary File 1 -- States Released Update ... final set of state SF1 data now scheduled for release (8/25/11). http://proximityone.com/cen2010_sf1.htm 08.16.11. Texas School/School District Performance (TXSDP) - TXSDP3 Project http://proximityone.com/txsdp3.htm 08.16.11. Texas School/School District Performance (TXSDP) Analysis http://proximityone.com/txsdp.htm 08.16.11. TXSDP -- TAKS 2011 Subject Matter Items http://proximityone.com/taks2011items.htm 08.15.11. Sustainable School Performance Improvement http://proximityone.com/schoolimprovement.htm 08.15.11. Texas Decision Making Information http://proximityone.com/schoolimprovement.htm 08.11.11. ZIP-Place Demographic Patterns ... ranking table updated with Census 2010 demographics; 6 states added http://proximityone.com/zip-place.htm 08.10.11. Largest School Districts ... ranking table updated with 2010-11 school year data http://proximityone.com/lgsd.htm |